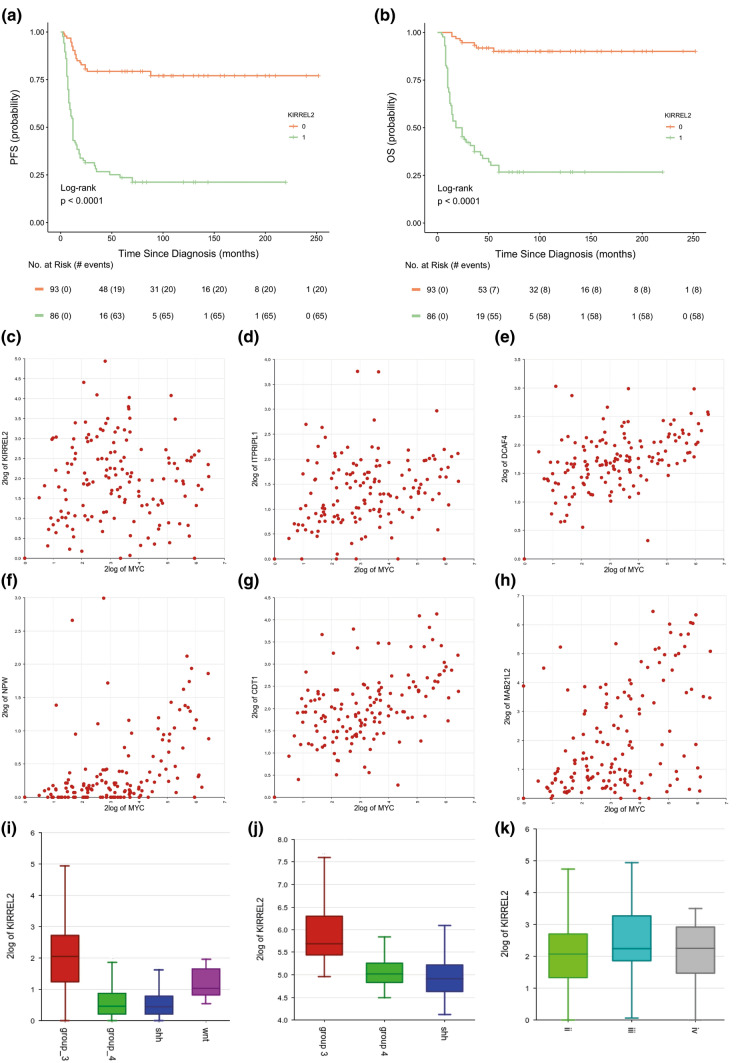
Fig. 2.
Progression-free (a) and overall (b) survival analysis revealed that high levels of KIRREL2 expression (a cut-off log2 RPKM > 2.5; green line) are significantly associated with worse outcomes in Grp 3 MB (log-rank test; p < 0.01). c–h Scatter graphs show an absence of correlation between KIRREL2 and MYC expression (c; correlation coefficient: − 0.074; p = 0.374), whereas expression of ITPRIPL1 (d), DCAF4 (e), NPW (f), CDT1 (g), MAB21L2 (h) was correlated strongly with MYC expression (all p < 0.01). i. KIRREL2 expression was higher in Grp 3 MB (red boxplot; n = 179) as compared to WNT-MB (violet boxplot; n = 20), SHH-MB (blue boxplot; n = 188) and Grp 4 MB (green boxplot; n = 260) in the current/screening RNA_seq MB set (t-test; p < 0.01). j KIRREL2 expression was also higher in Grp 3 MB (red boxplot; n = 46) as compared to SHH-MB (blue boxplot; n = 51) and Grp 4 MB (green boxplot; n = 188) in independent/validation set generated with Affymetrix platform (t-test; p < 0.01). k. KIRREL2 expression is quite similar in these main second generation II (light-green boxplot), III (dark-green boxplot) and IV (gray boxplot) subgroups which composed 85% of Grp 3 MB (t-test; p = 0.323)

