Fig. 4.
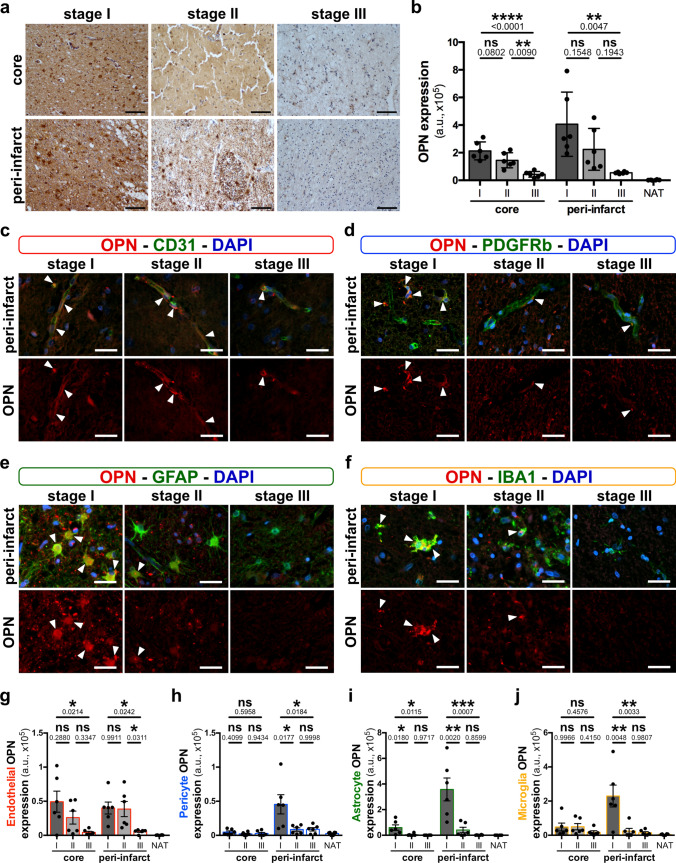
Osteopontin expression in normal and ischemic brain tissue of stroke patients. a Representative immunohistochemistry staining for osteopontin (OPN, brown) on human stroke samples at different stages (stage I–III) in the peri-infarct region and infarct core tissue. Stage I tissues were obtained 24–48 h post-vessel occlusion and present acute necrosis. Stage II is defined by macrophage resorption and stage III by the observation of pseudocystic cavity. b Quantification of OPN expression intensity (arbitrary unit, a.u.) in the infarct core, peri-infarct region and normal appearing tissue (NAT) at stages I–III; n = 6 individual specimens for each stage, **P < 0.01, ****P < 0.0001 and not significant (ns) P > 0.05 by one-way analysis of variance and Tukey’s multiple comparison test. c–f Representative images of immunofluorescence staining for OPN (red) and cell-specific markers (green) including CD31 for endothelial cells (c), PDGFRβ for pericytes (d), GFAP for astrocytes (e) and IBA1 for microglia/macrophages (f) in the peri-infarct regions. (g–j) Quantification of OPN expression in core, peri-infarct and normal appearing tissue endothelial cells (g), pericytes (h), astrocytes (i) and microglia/macrophages (j) at stages I–III, n = 6 individual specimens for each stage, *P < 0.05, **P < 0.01, ***P < 0.001, ****P < 0.0001 and ns P > 0.05 by one-way analysis of variance and Tukey’s multiple comparison test. Scale bars: 100 µm (a) and, 20 μm (c–f)

