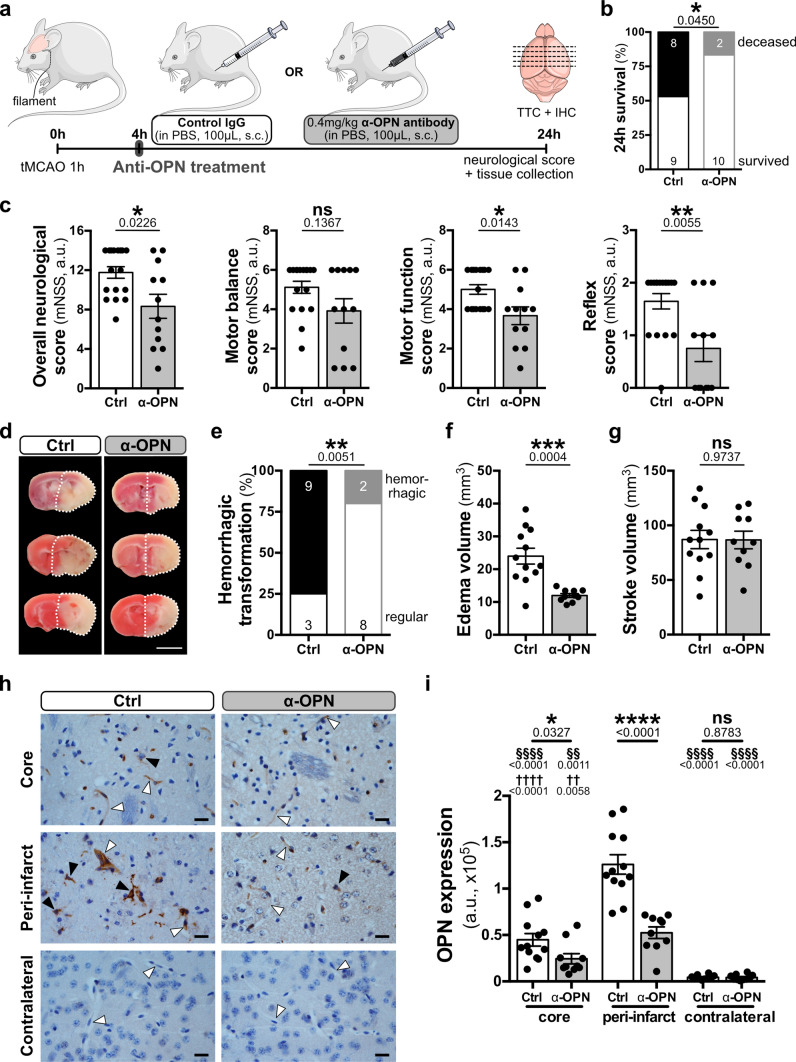
Fig. 5.
Neutralization of OPN improves clinical outcome in mice after acute ischemic stroke. a Schematic illustration depicting antibody treatment of mice 4 h after tMCAO with either 0.4 mg/kg control IgG or anti-OPN antibody (α-OPN) injected subcutaneously (s.c.). b–i Outcome parameters assessed 24 h after tMCAO in mice treated with Ctrl IgG or α-OPN antibody. All animals that passed the exclusion criteria were included for the survival and neurological score analysis. For analysis of hemorrhagic transformation, edema and stroke volumes, and OPN expression only mice that survived 24 h were included. b 24 h survival proportion with numbers in histograms indicating animals that died or survived in each group; n = 17 (Ctrl; 11 males and 6 females) and n = 12 (α-OPN; 8 males and 4 females), *P < 0.05 by one-tailed Chi-square test. c Total mNSS including motor balance, motor function and reflexes scores; n = 17 (Ctrl) and n = 12 (α-OPN), *P < 0.05, **P < 0.01, and not significant (ns) P > 0.05 by Mann Whitney test. d Representative TTC stained coronal brain slices of three Ctrl IgG and α-OPN antibody-treated mice demonstrating damaged brain tissue area (white) and hemorrhagic transformation of stroke lesions. Expansion of ischemic hemisphere is indicated by a white dotted line. e Hemorrhagic transformation frequency of stroke lesions. f Edema volume. g Stroke volume; n = 12 (6 for both males and females) and n = 10 (6 males and 4 females) for Ctrl IgG and α-OPN antibody treatment group, respectively; **P < 0.01 and ***P < 0.001, and ns P > 0.05 by one-tailed Chi-square test for (e) and by two-tailed, unpaired t-test, with Welch’s correction when variances were significantly different based on F-test, for (f) and (g). h Representative IHC staining demonstrating OPN expression 24 h after tMCAO in the infarct core, peri-infarct region and contralateral hemisphere of animals treated with either control IgG or α-OPN antibody. White and black arrowheads identify vessels and OPN expressing parenchymal cells, respectively. i Quantification of OPN expression intensity (arbitrary unit, a.u.) in Ctrl and α-OPN antibody-treated mice 24 h post-ischemic stroke utilizing three images/region/animal, n = 12 and n = 10 for Ctrl IgG and α-OPN antibody treatment group, respectively; *P < 0.05, §§/††P < 0.01, ****/§§§§/††††P < 0.001 and ns P > 0.05. *Two-tailed, unpaired t test comparing the two treatments groups for the same region, §two-tailed, paired t test comparison of peri-infarct to infarct core or contralateral hemisphere within the same treatment group/animal, and †two-tailed paired t test comparison of the infarct core and contralateral hemisphere within the same treatment group/animal. Scale bars: 5 mm (d) 20 μm (h)

