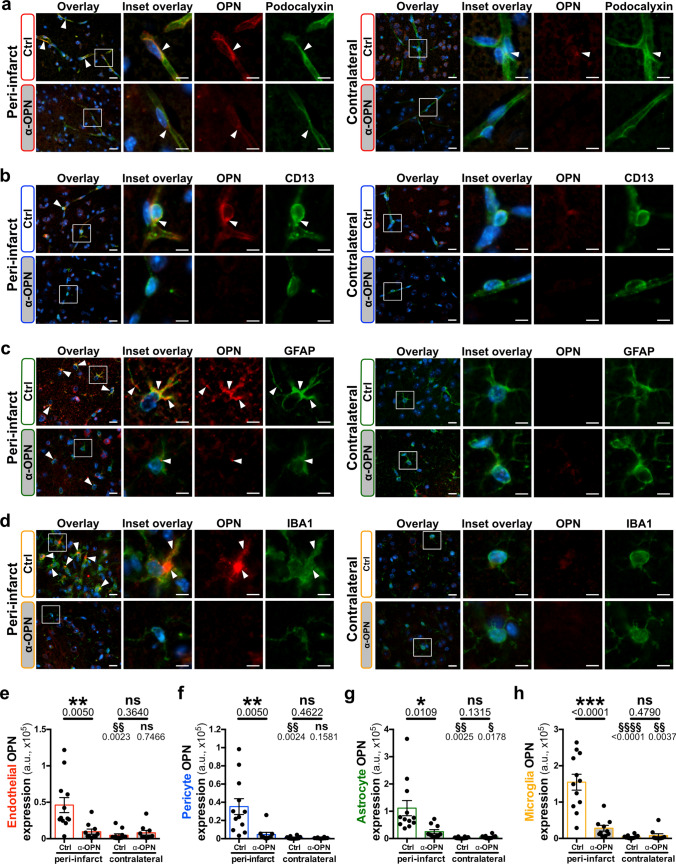
Fig. 6.
Anti-OPN antibody treatment neutralizes OPN in peri-infarct NVU cells in mice post-acute ischemic stroke. a–d Representative images of immunofluorescence staining for OPN (red) and cell-specific markers (green) including podocalyxin for endothelial cells (a), CD13 for pericytes (b), GFAP for astrocytes (c) and IBA1 for microglia/macrophages (d) in the peri-infarct region (left) and contralateral hemisphere (right) of Ctrl IgG and α-OPN antibody-treated mice 24 h post-stroke. White arrowheads indicate OPN expressing NVU cells. e–h Quantification of OPN expression in peri-infarct and contralateral endothelial cells (e), pericytes (f), astrocytes (g) and microglia/macrophages (h) utilizing 3 images/region/animal, n = 12 and 10 for Ctrl and α-OPN, respectively. */§P < 0.05, **/§§P < 0.01, ***P < 0.001, §§§§P < 0.0001 and ns P > 0.05. *Two-tailed, unpaired t test, with Welch’s correction when variances were significantly different based on F test, comparing the two treatments groups for the same region, and §two-tailed, paired t-test comparison of the peri-infarct and contralateral hemisphere within the same treatment group/animal. Scale bars: 10 µm and 5 µm in insets (a–d)

