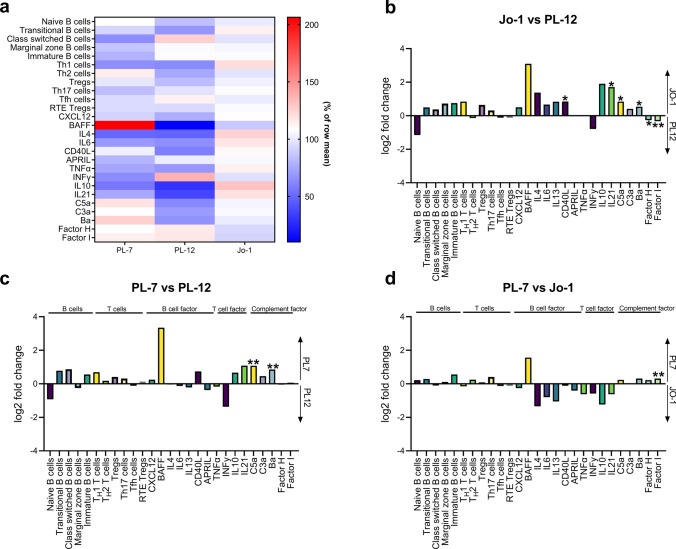
Fig. 2.
Immune profiles demonstrate subtle differences between serological ASyS subgroups. In-depth immune analyses as performed in Fig. 1 were compared for serological ASyS subgroups: anti-Jo-1+ (n = 22), PL-7+ (n = 8) and PL-12+ (n = 6). Heatmap displaying changes to cellular and soluble factors for serological subgroups (a). Data is displayed as median with normalization to the row mean. Two-sided comparison between subgroups is displayed as bar graph (b, c, d) with log2 fold change of the median on the y-axis. Significant differences between groups are indicated. Differences between groups were analyzed using the Kruskal–Wallis test followed by the Bonferroni-Dunn correction for multiple comparisons. The level of significance was set to p < 0.05. *p < 0.05, **p < 0.01. CM central memory, EM effector memory, RTE recent thymic emigrates

