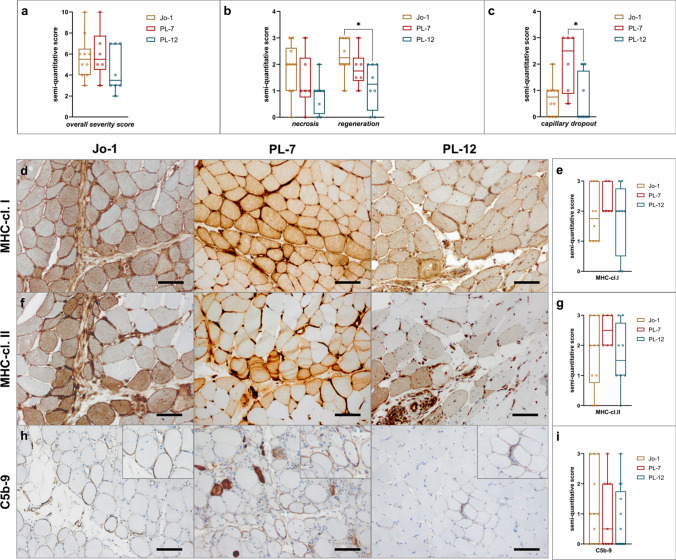
Fig. 3.
Muscle morphological features of ASyS were similar between serological ASyS subgroups. Analysis of skeletal muscle biopsies by immunohistochemistry (a, b, c, e, g, i). Muscle morphology was quantified and compared between subgroups by semi-quantitative score. Muscle biopsies from anti-Jo-1+ (n = 10), PL-7+ (n = 6) and PL-12+ (n = 8) patients were analyzed. Representative muscle biopsies are displayed (d) for C5b-9, MHC-cl. I and MHC-cl. II for serological subgroups. Scale bar 100 µm. Differences between groups were analyzed using the Kruskal–Wallis test followed by the Bonferroni-Dunn correction for multiple comparisons. The level of significance was set to p < 0.05. *p < 0.05. cl. = class

