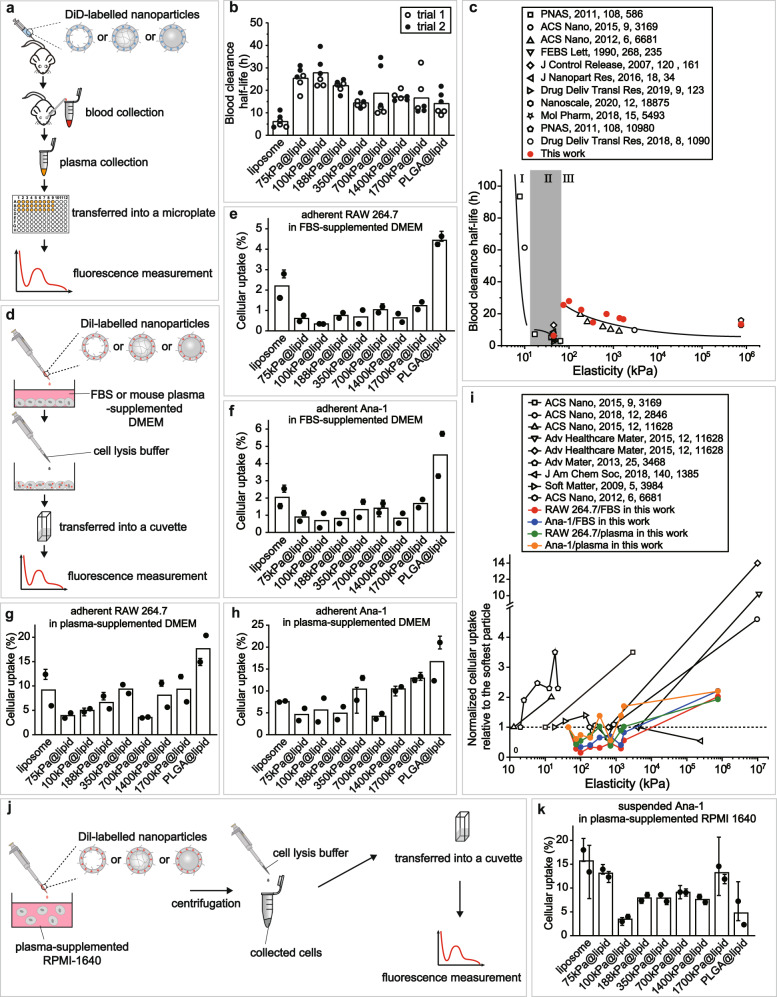
Fig. 2. Effects of nanoparticle elasticity on blood circulation lifetime and cellular uptake.
a Schematic illustration on blood circulation test for obtaining blood retention profiles for our nanoparticles. b Blood clearance half-lives of our model nanoparticles. Bar heights are reported as averages of two independent trials (n = 3 biologically independent mice in each independent trial). c Plot on the relationship of blood clearance half-life versus nanoparticle elasticity, using results from this work and prior reports on this topic. d Schematic illustration on in vitro cellular uptake assays. Uptake efficiency of nanoparticles by murine macrophage e RAW264.7 and f Ana-1 cells. Bar heights are reported as averages of two independent trials, while data points are reported as average ± standard deviation (n = 3 in each independent trial). Uptake efficiency of our nanoparticles by adherent g RAW264.7 and h Ana-1 cells in mouse plasma-supplemented culture medium. Bar heights are reported as average of two independent trials, while data points are reported as average ± standard deviation (n = 3 in each independent trial). i Plots on the relationship of normalized cellular uptake relative to the softest particle in a same study versus nanoparticle elasticity, using results from this work and prior reports on this topic. j Schematic illustration on in vitro cellular uptake assays by suspended Ana-1 in mouse plasma-supplemented culture medium. k Uptake efficiency of our nanoparticles by suspended Ana-1 in mouse plasma-supplemented culture medium. Bar heights are reported as average of two independent trials, while data points are reported as average ± standard deviation (n = 3 in each independent trial).

