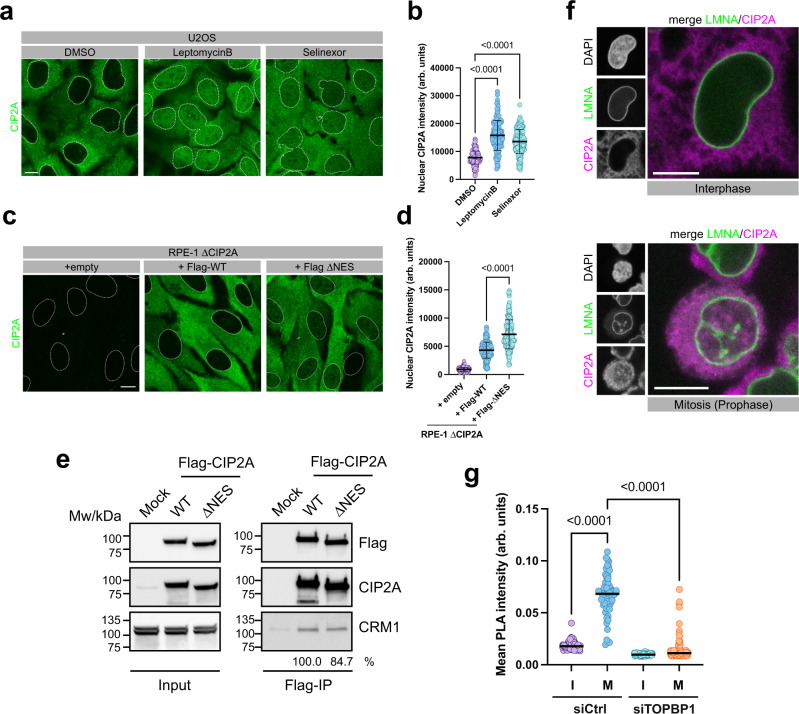
Fig. 7. CRM1-dependent nuclear export sequesters CIP2A from TOPBP1 in interphase cells.
a Confocal micrographs (maximum intensity projections) of Leptomycin B, Selinexor and control DMSO treated U2OS cells, stained for CIP2A. b Quantification of nuclear CIP2A staining of the experiment in a. Each data point corresponds to one cell (DMSO: n = 173, LeptomycinB: n = 150, Selinexor: n = 178, pooled from two independent experiments). Bars and error bars represent mean and SD. Statistical significance was calculated using one-way ANOVA and Dunnett’s multiple comparison test (α = 0.05). c Confocal micrographs (maximum intensity projections) of RPE-1 ΔCIP2A cells and RPE-1 ΔCIP2A cells stably transduced with Flag-tagged full-length CIP2A (WT) and CIP2A deletion mutant (human CIP2A amino acids 561–625; ΔNES), stained for CIP2A. d Quantification of nuclear CIP2A staining of the experiment in c. Each data point corresponds to one cell (+Epmpty: n = 199, +Flag-WT: n = 155, +Flag-ΔNES: n = 165, pooled from two independent experiments). Bars and error bars represent mean and SD. Statistical significance between +Flag-WT and +Flag-ΔNES was calculated using two-sided Welch’s t-test (α = 0.05). e Flag-immunoprecipitation from 293FT cells either Mock transfected (Mock) or transfected with a Flag-tagged full-length CIP2A wild type (WT), and Flag-tagged CIP2A lacking amino acids 561-625 (ΔNES). Relative intensities of co-immunoprecipitated CRM1 bands are indicated. f Confocal micrograph (maximum intensity projection) of Hela cells expressing endogenous Clover-tagged LMNA and stained for CIP2A. g Quantification of CIP2A-TOPBP1 proximity by in situ PLA in U2OS cells transfected with control siRNA (siCtrl) and siRNA against TOPBP1 (siTOPBP1), arrested in mitosis by Nocodazole and treated with 1 Gy of IR. Interphase cells (I) were separated from mitotic cells (M) with an automatic image analysis pipeline, based on DAPI mean intensities. Each data point represents one cell (siCtrl I: n = 92, siCtrl M: n = 63, siTOPBP1 I: n = 138, siTOPBP1 M: n = 121; pooled from two independent experiments), and bars represent median. Statistical significance was assessed by Kruskal-Wallis test and Dunn’s multiple comparison test (α = 0.05). Source data are provided as a Source Data file.

