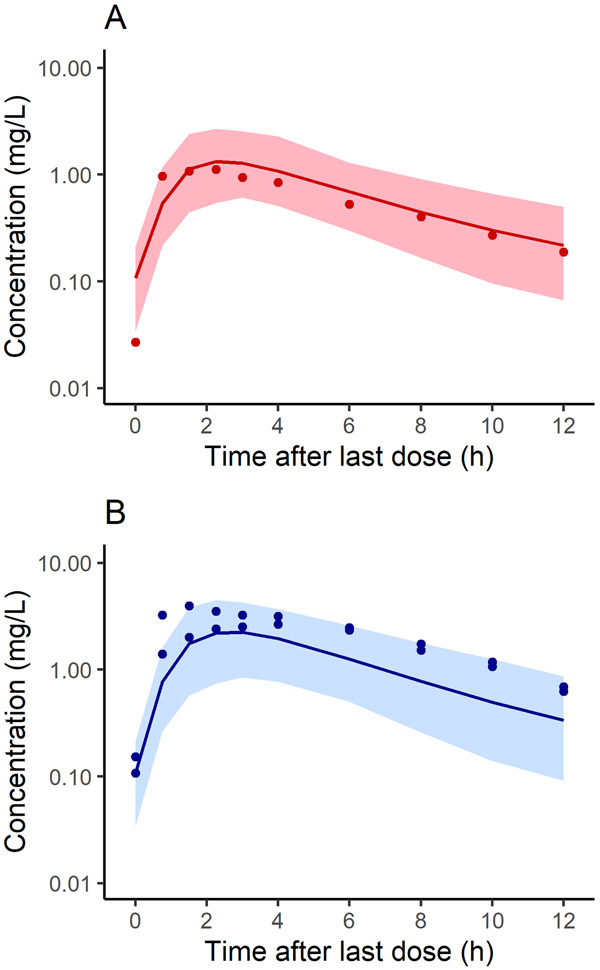
Figure 1.
Population simulations (n=100) of plasma concentration in non-overweight young girls at steady state following a 425 mg (A) or 850 mg (B) dose of metformin. Shown are simulated mean concentrations (solid line) and the 90% prediction interval (shaded region) for each population overlaid with the corresponding observed data. Demographics for the virtual populations were matched to reflect the observed data. Observed data were collected over 12 h from 9 y old non-overweight girls who received once daily doses of metformin for 8 months for early-normal puberty.12

