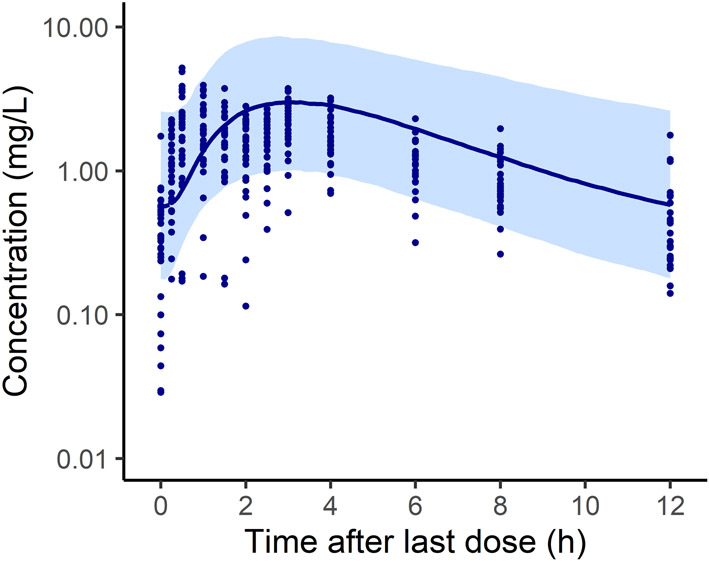
Figure 2.
Composite population simulation (n=1,000) of plasma concentration in children and adolescents with severe obesity following a 1,000 mg dose of metformin. Shown are simulated median concentration (solid line) for the population and the 90% prediction interval (shaded region); the corresponding simulation for the 2 patients who received 500 mg doses is shown in Supplementary Figure S3; the composite virtual population was generated using the mean demographics from the published study (Table 1). Observed data presented in this figure were collected over 12 h from 28 children with severe obesity who had been receiving 1,000 mg twice daily metformin therapy for 6 months.14 Individual-level data are also presented in Supplementary Figures S2 and S4. Extended BMI percentile was calculated as BMI divided by the 95th percentile for a subject's age and sex.

