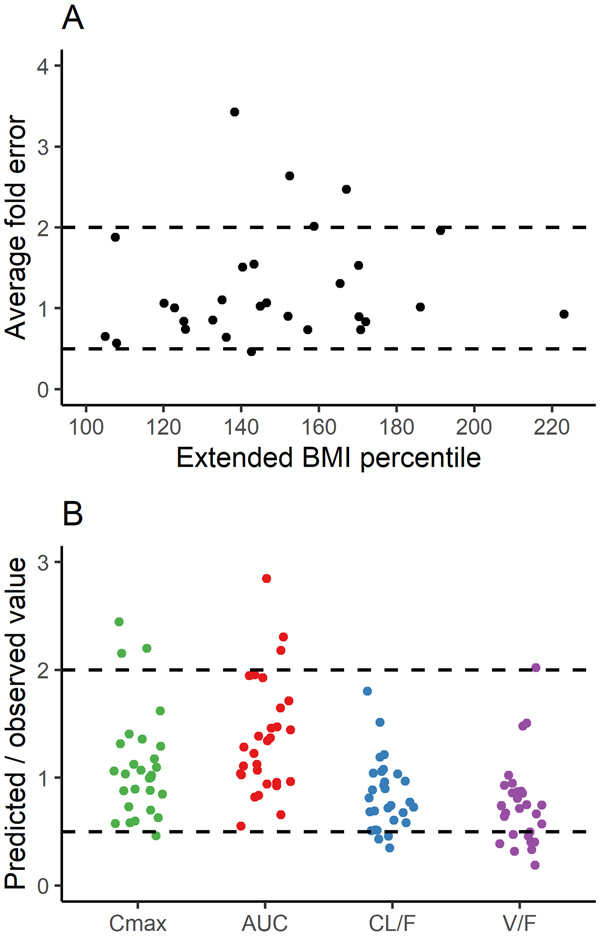
Figure 3.
Average fold error of predicted to observed metformin plasma concentrations compared across extended BMI percentile (A) and the ratios of predicted to observed values for pharmacokinetic parameters (B) in children with severe obesity. Dashed lines represent the 2-fold error range. Panel A includes comparisons for 30 children and, due to missing data, panel B includes comparisons for 29 children. Extended BMI percentile was calculated as BMI divided by the 95th percentile for a subject's age and sex. Parameters include AUC, or area under the concentration-time curve (calculated from 0 to 12 h at steady state); CL/F, or oral clearance (calculated as dose / AUC); Cmax, or maximum plasma concentration of metformin at steady state; and V/F, or apparent volume of distribution (calculated as CL/F divided by the elimination rate constant).

