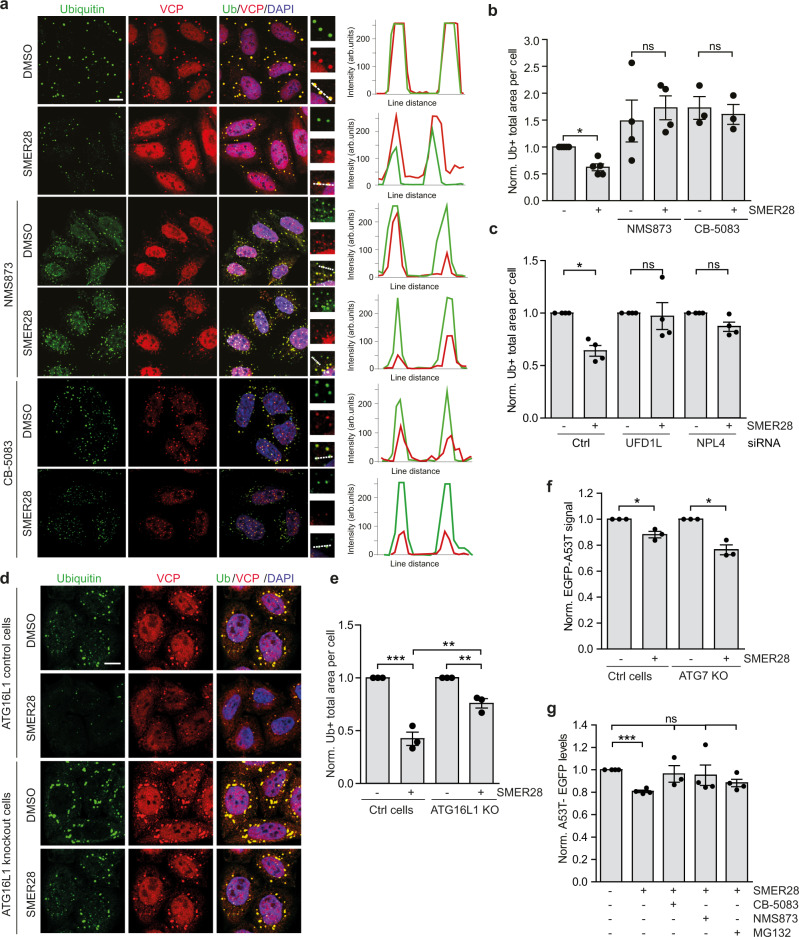
Fig. 8. SMER28 induces degradation of misfolded and aggregate-prone proteins in UPS and autophagy-dependent manner.
a, b HeLa cells were pre-treated with 20 µM SMER28 with or without 10 µM NMS873 or 5 µM CB-5083 for 1 h, followed by addition of puromycin for 4 h. Cells were fixed and stained for VCP puncta and ubiquitin-positive structures, quantification of the total area of ubiquitin-positive foci in (b paired two-tailed Student’s t test, DMSO P = 0.0039). Line scans indicate the degree of colocalisation between VCP (red) and Ubiquitin (green) in lines drawn within the magnified images. The intensity profiles are presented as arbitrary units (arb. units); n = 5; Manders’ Colocalisation Coefficient analysis in Supplementary Fig. 7d.c HeLa cells were treated with siRNA against UFD1L or NPL4 and after 48 h were pre-treated with 20 µM SMER28 or DMSO for 1 h followed by treatment with puromycin for 4 h, representative images in Supplementary Fig. 7c and Manders’ Colocalisation Coefficient analysis in Supplementary Fig. 7e, n = 4; one sample t test, Ctrl P = 0.0058. d, e ATG16L1 knockout and control cells were pre-treated with 20 µM SMER28 or DMSO for 1 h, followed by addition of puromycin for 3 h, statistical analysis in (e one-way ANOVA: P < 0.0001 with post hoc Tukey test, Ctrl SMER28 P < 0.0001, Ctrl vs. KO SMER28 P = 0.0012, KO SMER28 P = 0.0094), n = 3. f HeLa cells stably expressing A53T-SNCA-EGFP in wild-type or ATG7 knockout cells were treated with 20 µM SMER28 for 24 h, followed by FACS analysis; n = 3; one sample t test, WT P = 0.041, ATG7KO P = 0.0244. g ATG7 knockout HeLa cells stably expressing A53T-SNCA-EGFP were treated with 0.5 µM CB-5083, 1 µM NMS873, or 1 µM MG132 combined with 20 µM SMER28 for 24 h, followed by FACS analysis; n = 4; Kruskal–Wallis test: P = 0.0199 with post hoc Dunn’s Multiple comparison test, SMER28 P = 0.0129. Bar graphs data presented as normalized mean ± SEM. *P < 0.05, **P < 0.001, ***P < 0.0001; scale bar = 10 μm; ns not significant, Ctrl control cells. Source data are provided as a Source Data file.

