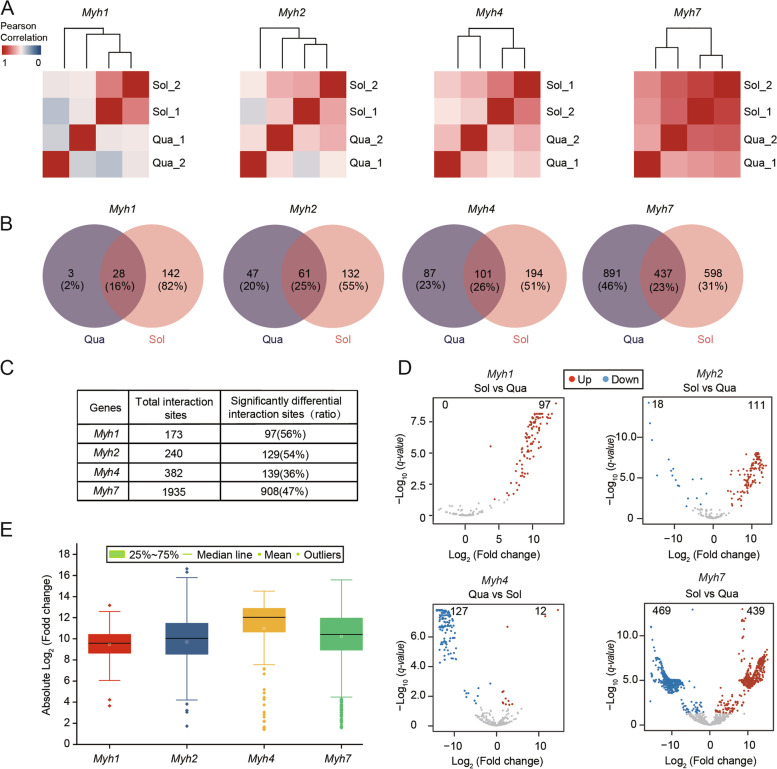
Fig. 2.
Chromatin interaction alterations of Myh genes between quadriceps and soleus. A Heatmap showing the clustering of Myh genes interactions in quadriceps and soleus. The color scale indicates the degree of correlation (blue, low correlation; red, high correlation). The clustering was generated using the Pearson correlation coefficient of interaction sites every 1 Mb bin; B A Venn diagram showing the number of common and unique genome-wide interactions site of the Myh genes between quadriceps and soleus; C Differential analysis of interaction sites identified reproducibly in two biological replicates; D Volcano plot of significantly differential interaction sites (SDISs) of Myh genes. The threshold of SDISs in the volcano plot was absolute log2Fold Change > 1 and padj < 0.05. Red and blue indicate significantly differential interaction sites; E The average absolute log2Fold Change of SDISs of the Myh genes

