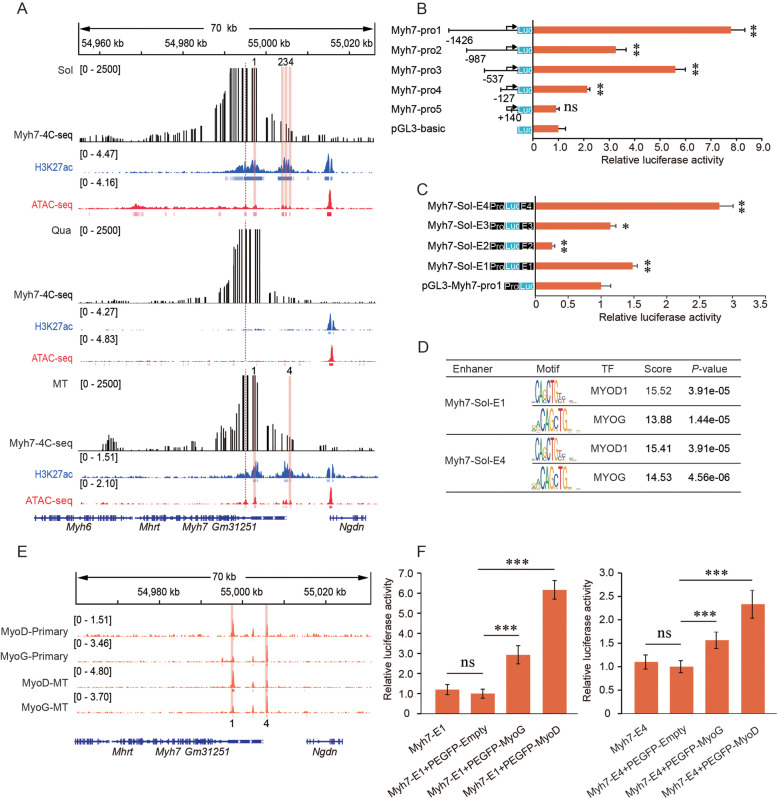
Fig. 4.
Binding of transcription factors at enhancers of Myh7 in soleus. A Active enhancers Myh7 in quadriceps, soleus and C2C12. 4C-seq interaction profile (black), ChIP-seq profiles for H3K27ac (blue), and ATAC-seq (red). The vertical dashed red line indicates the 4C viewpoint, and light red bars indicate candidate enhancer regions. The blue and red vertical lines below the ChIP-seq and ATAC-seq profiles indicate the peak; B The relative promoter activity of different Myh7 promoter regions was evaluated by luciferase reporter assay in H293 T cells. The pGL3-Basic was used as a control; C Dual-luciferase reporter assays to determine Myh7 candidate enhancer activity in H293 T cells. The pGL3-Myh7-pro1 was used as a control. D TF binding to the Myh7-Sol-E1, Myh7-Sol-E4 were predicted by JASPAR and AnimalTFDB3.0 website; E Public C2C12 myotubes and primary skeletal muscle cells ChIP-seq data were analyzed to show profiles of transcription factors in the Myh7-Sol-E1 and Myh7-Sol-E4 region. Light red bars indicate Myh7 active enhancer regions; F pGL3-Myh7-promoter reporter constructs containing the Myh7-Sol-E1 or Myh7-Sol-E4 region were transfected into H293 T cells with control or TF overexpression, then luciferase activity was determined. Data are represented as mean ± SD of three independent experiments, and p-values are calculated using Student’s t-test (*P < 0.05; **P < 0.01; ***P < 0.001)

