Figure 4.

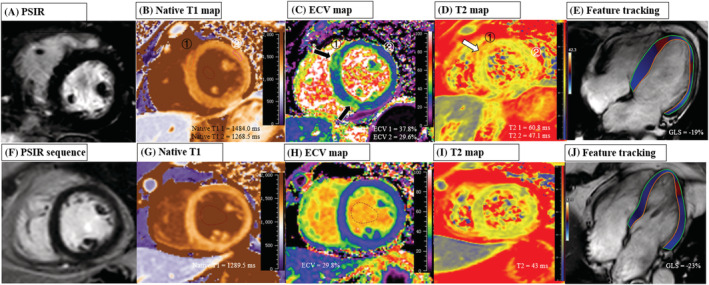
The typical images of the multi‐parameter cardiac MRI findings of patients and controls. Top row: Images in a 63‐year‐old female (patient subject) with severe clinical type of Delta Variant, showing negative LGE, elevated global native T1 of 1405.7 ms, elevated ECV of 33.4%, elevated T2 of 57.1 ms, and reduced GLS of −19.0%. In addition, the ECV map (C) and T2 map (D) showed higher ECV (black arrow) and T2 values (white arrow) at the mid‐level of LV in septal segments (ROI 1: ECV = 37.8%, T2 = 60.8 ms) compared with remote normal myocardium (ROI 2: ECV = 29.6%, T2 = 47.1 ms), but the corresponding LGE location was negative; Bottom row: Images in a 57‐year‐old female (control subject) with negative LGE, normal global native T1 (1289.5 ms), normal ECV of 29.8%, normal global T2 (43 ms), and a GLS of −22.7%. ECV, extracellular volume; GLS, global longitudinal strain; LGE, late gadolinium enhancement; PSIR, phase sensitive inversion recovery; SSFP, steady‐state free‐precession.
