Figure 1.

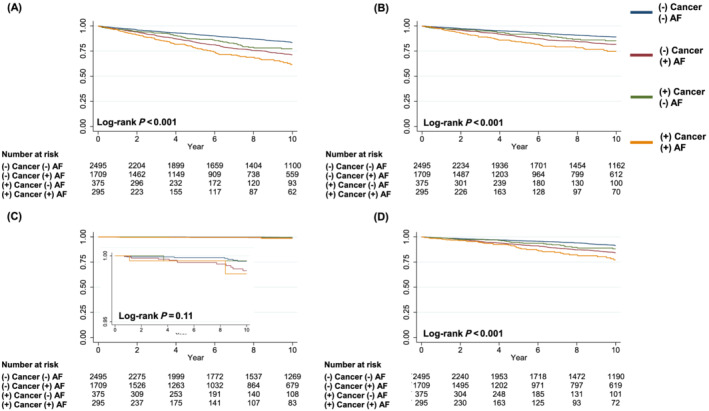
Kaplan–Meier curves representing association of AF and a history of cancer with (A) composite of stroke, systemic thrombosis, and major bleeding, (B) stroke, (C) systemic thrombosis, and (D) major bleeding. AF, atrial fibrillation.

Kaplan–Meier curves representing association of AF and a history of cancer with (A) composite of stroke, systemic thrombosis, and major bleeding, (B) stroke, (C) systemic thrombosis, and (D) major bleeding. AF, atrial fibrillation.