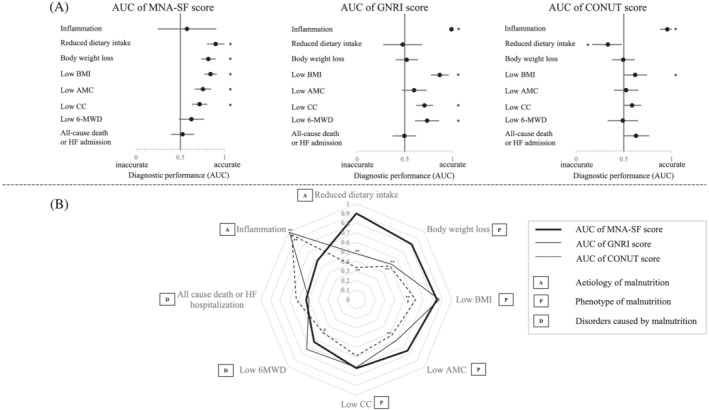
Figure 3.

Forest plot and radar chart of the AUC for the three nutritional indicators in assessing nutritional status, physical function, and prognosis. (A) Forest plot of the AUC for the MNA‐SF, GNRI, and CONUT scores. AUC is an indicator of diagnostic performance. An AUC of 0.5 indicates that the diagnostic performance is neutral; an AUC higher than 0.5 indicates that the diagnostic performance is high; and an AUC lower than 0.5 indicates that the diagnosis is incorrect. (B) The radar chart of the AUC for the MNA‐SF, GNRI, and CONUT scores. *P < 0.05 (A). **P < 0.05 for MNA‐SF, # P < 0.05 for GNRI (B). 6‐MWD, 6 min walk distance; AMC, arm muscle circumference; AUC, area under the curve; BMI, body mass index; CC, calf circumference; CONUT, controlling nutritional status; GNRI, geriatric nutritional risk index; HF, heart failure; MNA‐SF, mini nutritional assessment‐short form.
