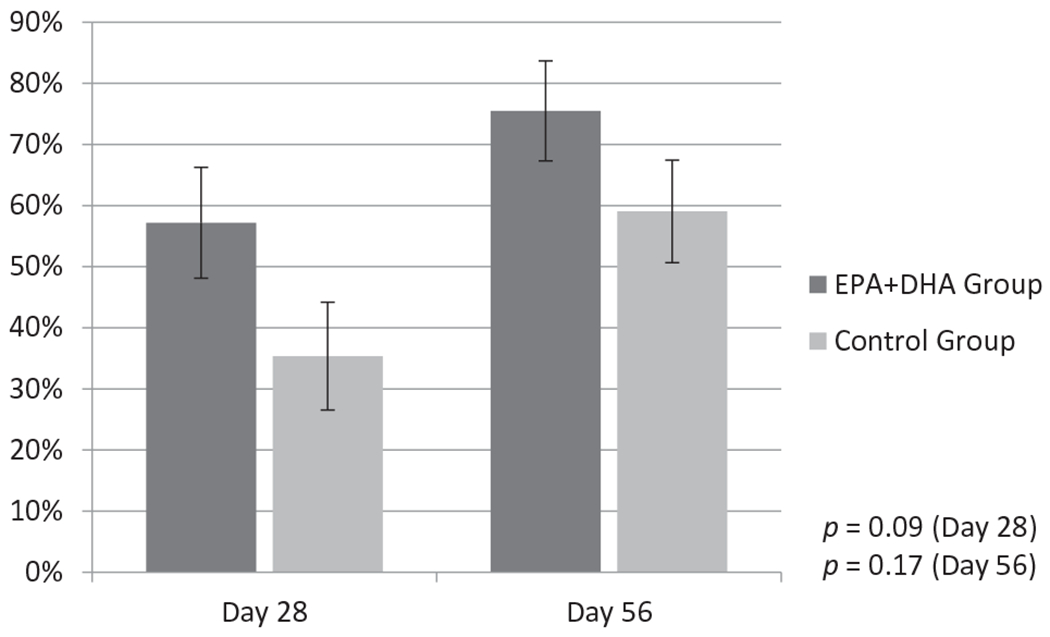
Figure 3.

Comparison of percent reduction in wound area at Day 28 and Day 56 of the study between the EPA+DHA Group and the Control Group. The graph provides comparisons between the EPA+DHA and Control Group in terms of percent reduction in wound area at Day 28 and Day 56 compared to Day 0. Each bar represents the mean percent reduction ± SEM. (Student’s t test, EPA+DHA Group: n = 16; Control Group: n = 19).
