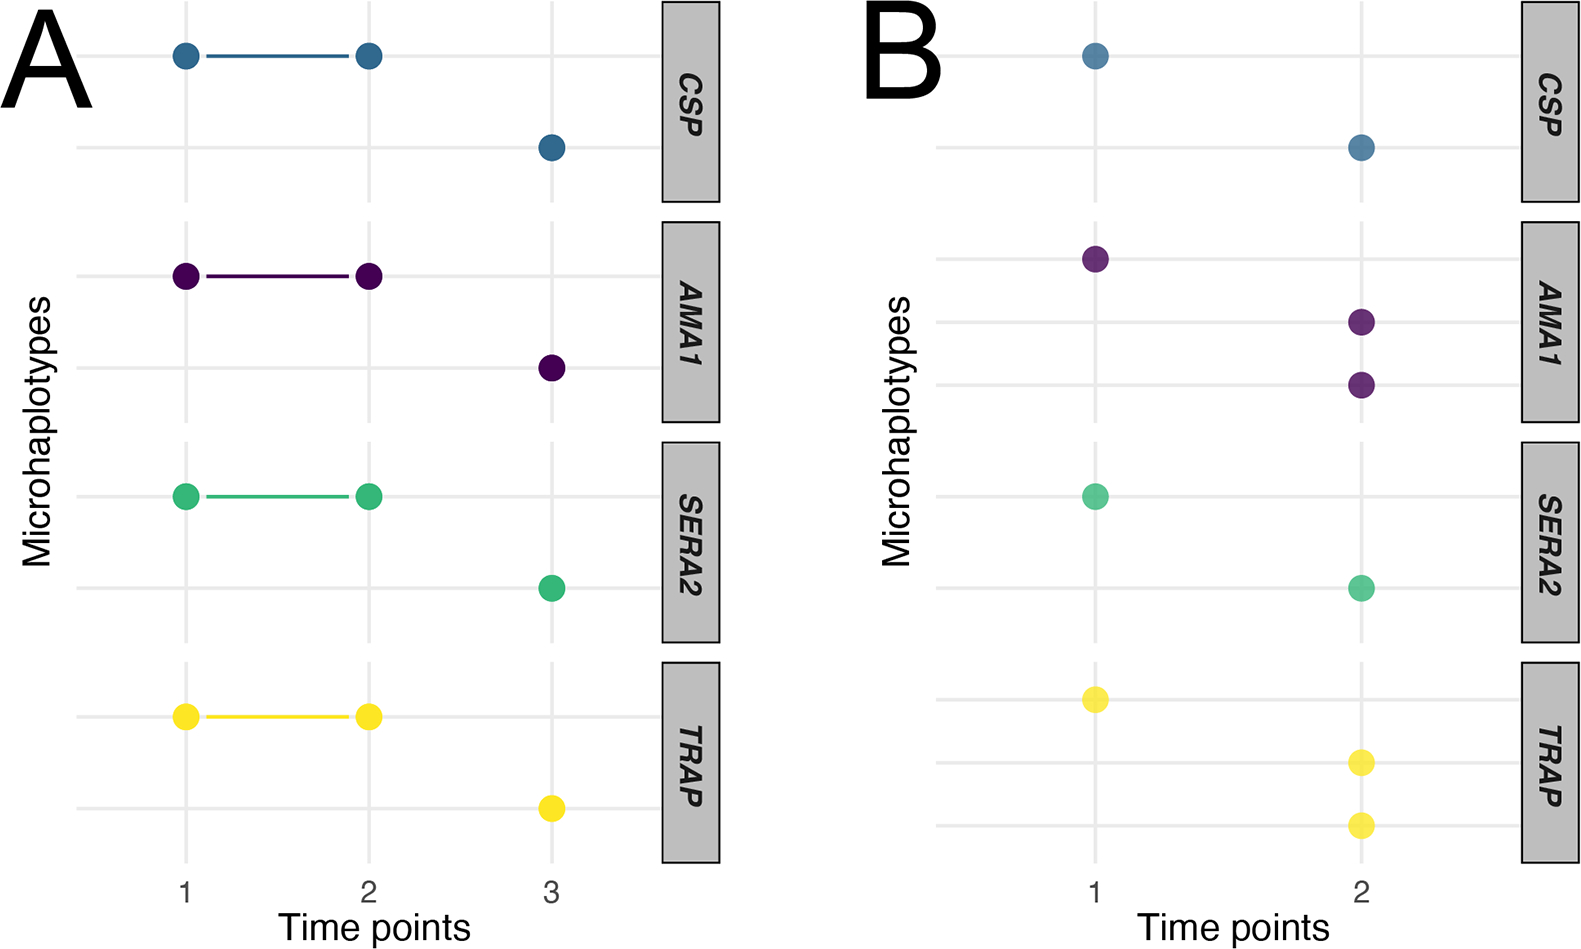
Figure 7. Longitudinal tracking of infections using 4CAST.

Identification of distinct microhaplotypes present in samples from two individuals. The x-axis represents consecutive time points, and the y-axis represents the individual microhaplotypes identified, grouped by locus. Colored points represent the presence of that microhaplotype, connected when present in multiple visits.
