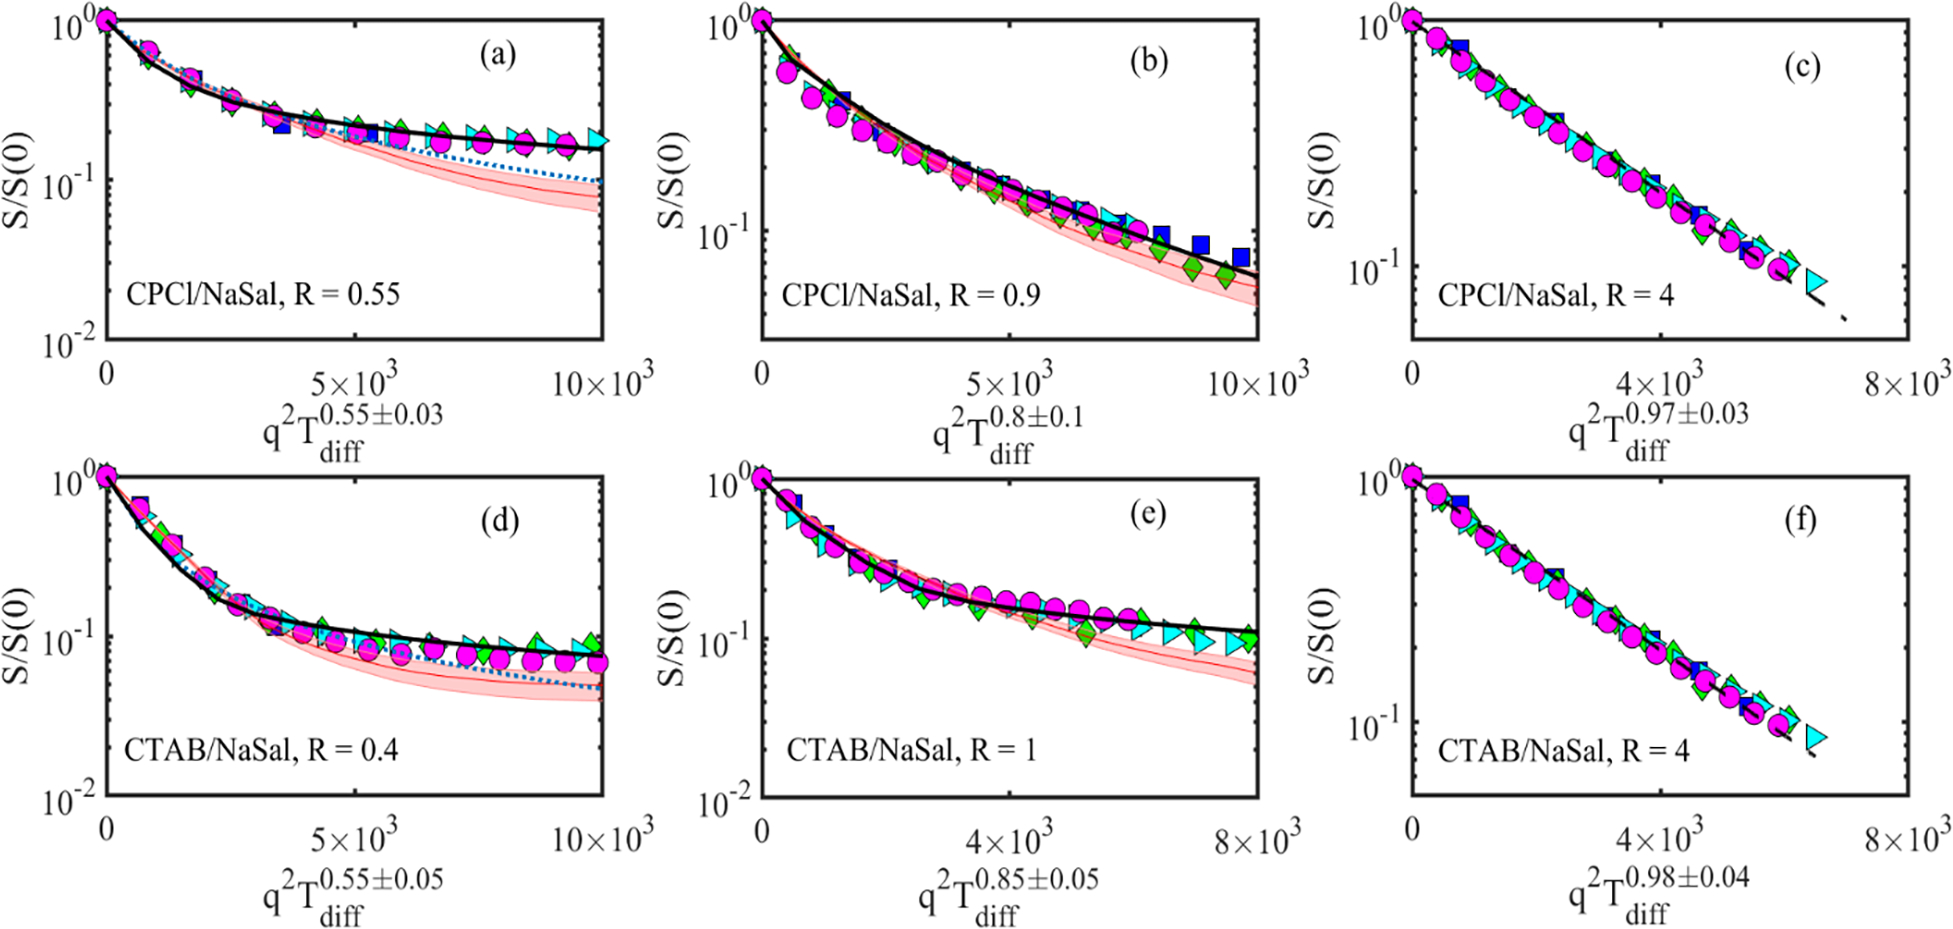
FIGURE 5.

Normalized NMR signal intensity of the surfactant peak (at a chemical shift 6.6 ppm) as a function of diffusion weighting. Top row shows the results for the CPCl/NaSal systems. In the above subfigures, each symbol corresponds to different diffusion time Tdiff; squares (15 ms), diamonds (50 ms), triangles (200 ms) and circles (500 ms). The shaded area, continuous line, dotted line and dashed line correspond to the best fit of Eq. (5), Eq. (6), Eq. (4) and Eq. (3), respectively, and discussed in section III of the paper.
