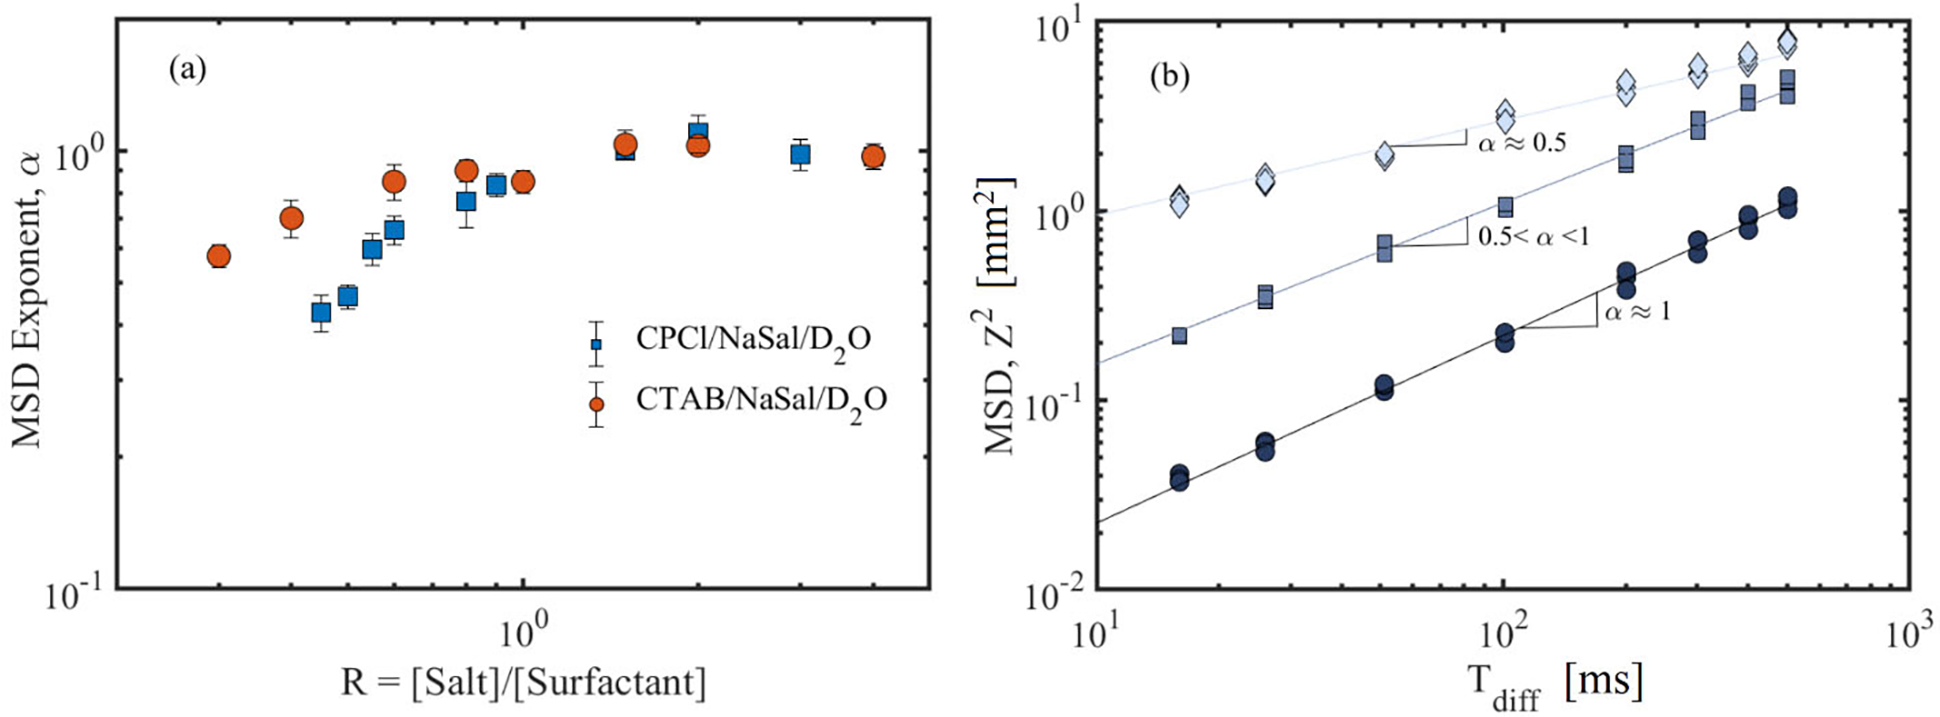
FIGURE 6.

(a) MSD exponent (α) as a function of salt-to-surfactant concentration ratio, R, for the two WLMs. These α values are obtained by superimposing the experimentally measured normalized NMR signals shown in Fig. 5. (b) MSD as a function of diffusion time shown for three self-diffusion behaviors reported in this study. Circles, squares and diamonds correspond to multiple sets of experimental data at high salt-to-surfactant ratios for moderately branched and linear wormlike micelles, respectively. Note that the MSD plots for each micellar regime have been shifted vertically for visual guide. Such vertical shifts do not affect the MSD scaling with respect to the diffusion time.
