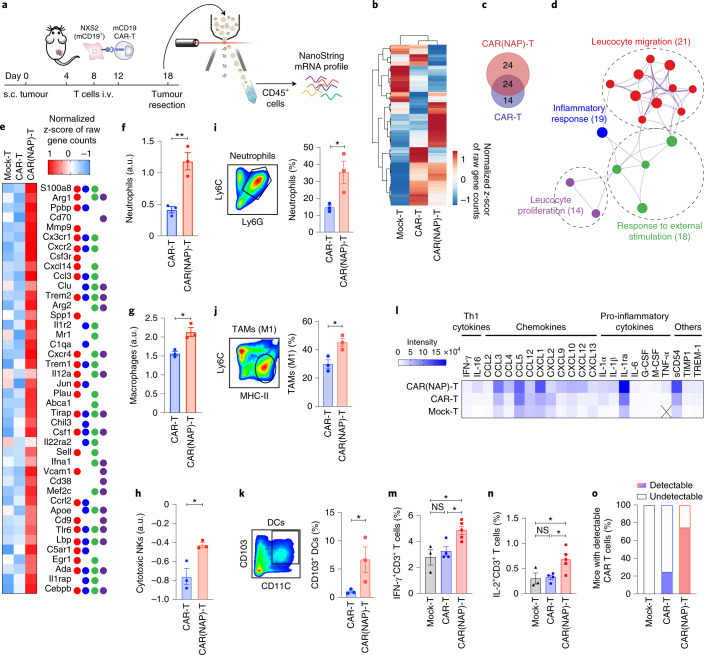
Fig. 3. CAR(NAP) T-cell treatment alters the immune composition of the tumour microenvironment leading to antitumour immunity.
a–h, CD45+ cells were isolated from NXS2-mCD19 tumours after CAR T-cell treatment and gene expression was analysed using NanoString. a, Schematic illustration of the experimental set-up. b, Heat map of gene expression presented as normalized z-score of raw gene counts. c, Upregulated genes (unique and overlapping) after treatment with CAR(NAP) T cells (red) and CAR T cells (blue) compared with mock T-cell treatment. d, Gene Ontology (GO) term enrichment network of uniquely upregulated genes after treatment with CAR(NAP) T cells versus CAR T cells, generated by Metascape analysis. Values in parentheses, –log10(P). e, Heat map of gene expression presented as normalized z-score of raw gene counts and their GO term pathways classification, colour-coded as in d. f–h, Abundance of tumour-infiltrating neutrophils (f), macrophages (g) and cytotoxic NK cells (h), determined from NanoString data. a.u., arbitrary units. i–k, Flow cytometry analysis of tumour-infiltrating immune cells in the NXS2-mCD19 tumour model. Gating strategies (left panels) and percentage (right panels) of tumour-infiltrating Ly6C+Ly6G+ neutrophils (i), Ly6ClowMHC-II+ M1 tumour-associated macrophages (j) and CD103+CD11C+ antigen-presenting DCs (k) are shown. l, Cytokine and chemokine levels in tumour lysate (X, below detection level). m, Percentage of IFN-γ producing cells in the CD3+ tumour-infiltrating T-cell population. n, Percentage of IL-2 producing cells in the CD3+ tumour-infiltrating T-cell population. o, Proportion of mice with qPCR-detectable tumour-infiltrating CAR-engineered T cells (n = 8). Groups were compared using t-test (*P < 0.05, **P < 0.01). In all panels, error bars represent s.e.m. Precise P values are reported in Supplementary Table 3.

