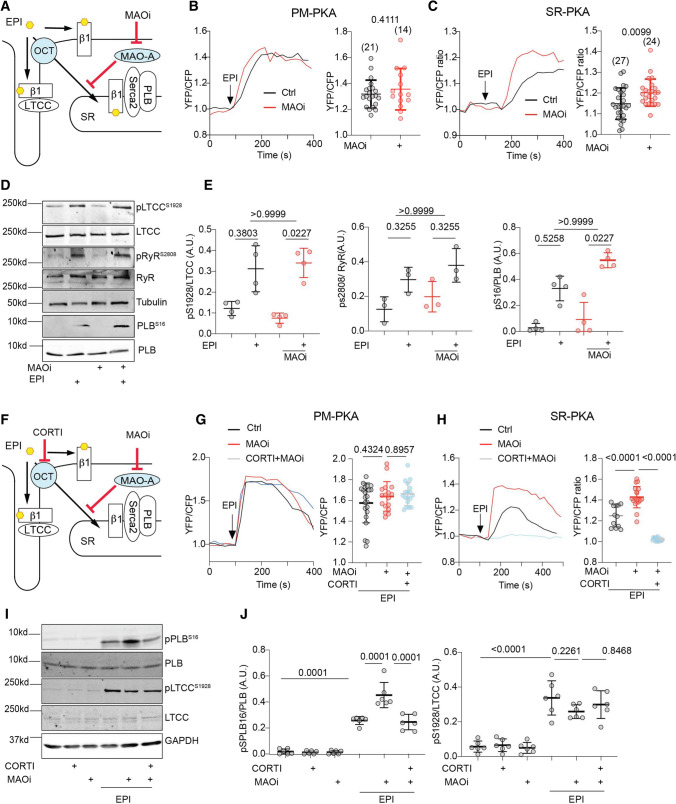
Fig. 3.
Corticosterone antagonizes the positive effects of MAOi on promoting SR-localized β1AR signaling and PLB phosphorylation. Mouse AVMs expressing AKAR3 biosensors were treated with drugs as indicated. YFP/CFP FRET ratio was recorded before and after agonist stimulation for total 400 s. The maximal FRET response after drug stimulation was plotted. AVMs was pretreated with MAOi or CORTI for 5 min and followed by 5-min incubation of β-agonists (EPI or DOB) for western blot. A Schematic of intracellular catecholamine hemostasis and local β1AR activation is modulated by OCT3 and MAO-A. B, C WT AVMs were stimulated with EPI after pretreatment with vehicle control (Ctrl) or MAOi. Time courses of FRET dynamics and quantification of local PKA activities at the PM and SR after EPI and MAOi administration were plotted. Dot plots represent the mean ± SD of the indicated number of AVMs from 4 WT mice. D, E Immunoblots show detection of phosphorylated Ca2+ handling proteins (p-Ser 16 of PLB, p-Ser 1928 of LTCC, and p-Ser 2808 of RyR2) in response to EPI in the presence of MAOi. n ≥ 3 WT mice. Data were shown as mean ± SD. F Schematic depicting the effects of CORTI on subcellular β1AR activation by inhibiting OCT3. G, H Time-course curves and quantification of local PKA activity at the PM and SR after EPI, MAOi, and CORTI coadministration were plotted. Dot plots represent the mean ± SD of the indicated number of AVMs from 4 WT mice. I, J Immunoblots show detection of phosphorylated LTCC (p-Ser 1928) and PLB (p-Ser 16) in response to coadministration of EPI, MAOi, and CORTI. n = 6 rabbits. Data were shown as mean ± SD. EPI = 1 µmol/L, MAOi = 5 µmol/L, and CORTI = 2 µmol/L. A.U. = arbitrary unit. p values were obtained by unpaired Student’s t test (B, C), non-parametric Kruskal–Wallis test followed with Dunn’s multiple comparisons test (E), or one-way ANOVA followed with Tukey’s test (G, H, J)

