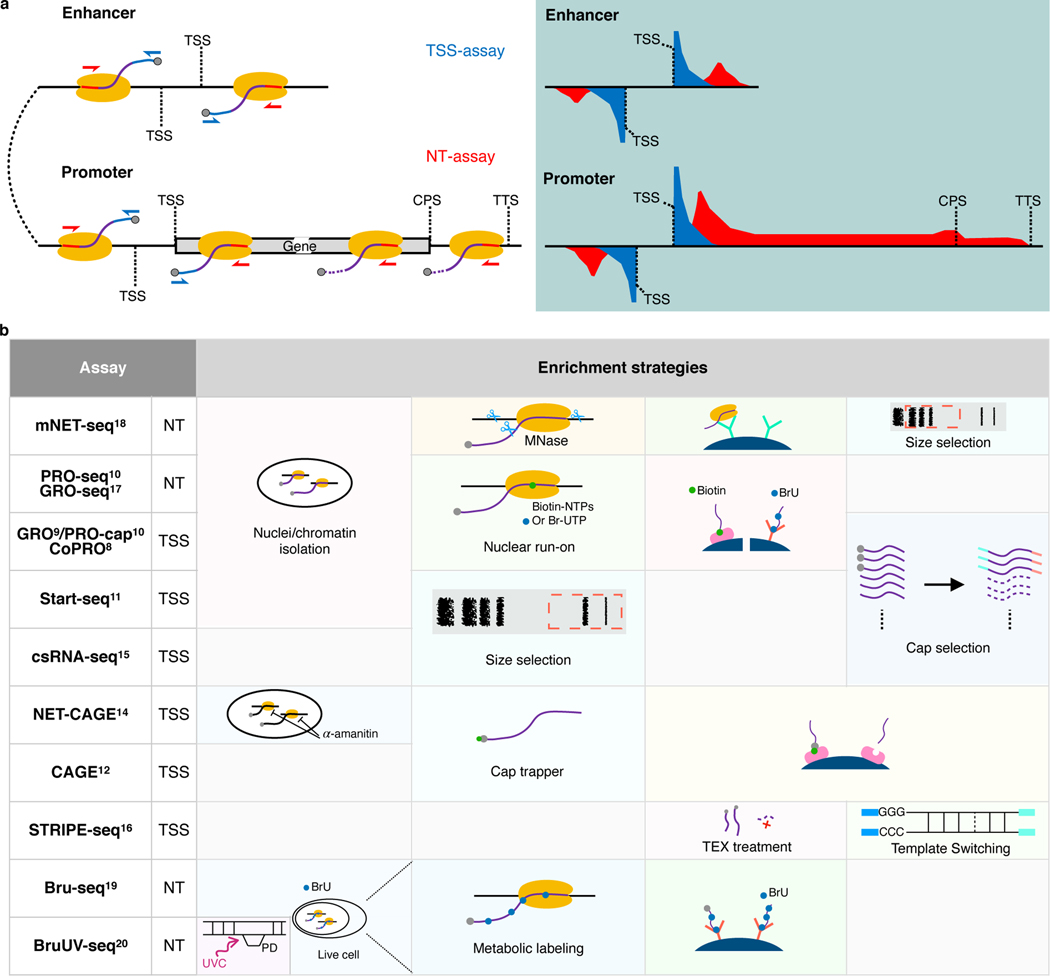
Fig. 1. Comparison of currently available assays for detecting eRNAs.
a, Schematics of enhancer and promoter/gene transcription by RNA Pol II (left panel) and characteristic profiles of TSS- and NT-assays (right panel, light-blue shaded area). Black lines represent genomic DNA; nascent RNAs are purple curved lines with 5′ and 3′ ends colored blue and red, respectively, with gray spheres as caps and yellow ovals indicate RNA Pol IIs. Arrows indicate the direction of sequencing reads, TSS-assay in blue, and NT-assay in red. Representative read density profiles are colored accordingly in blue and red for TSS- and NT-assays, respectively. TSS: transcription start site; CPS: cleavage polyadenylation site; TTS: transcription termination site. b, Enrichment strategies used by different TSS- and NT-assays. TEX: terminator exonuclease. A detailed description is available in Supplementary Notes.

