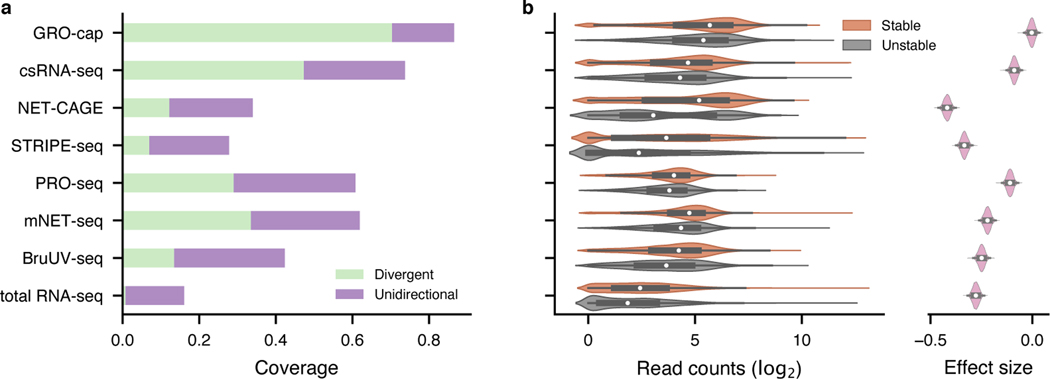
Fig. 2. Evaluation of assay sensitivity in eRNA detection.
a, The capability of different assays to capture validated enhancers (CRISPR-identified enhancer set). All libraries were downsampled to the same sequencing depth. “Unidirectional” and “divergent” indicate the detection of eRNAs originated from either one or both strands of the enhancer loci, respectively. b, Differences in read coverage among stable () and unstable () transcripts. GRO-cap has the highest coverage of both stable and unstable transcripts and the least preference toward stable transcripts. Preferences (effect sizes) were evaluated as Cohen’s d via bootstrap (). In the box plot, the center dots, box limits, and whiskers denote the median, upper and lower quartiles, and 1.5× interquartile range, respectively.

