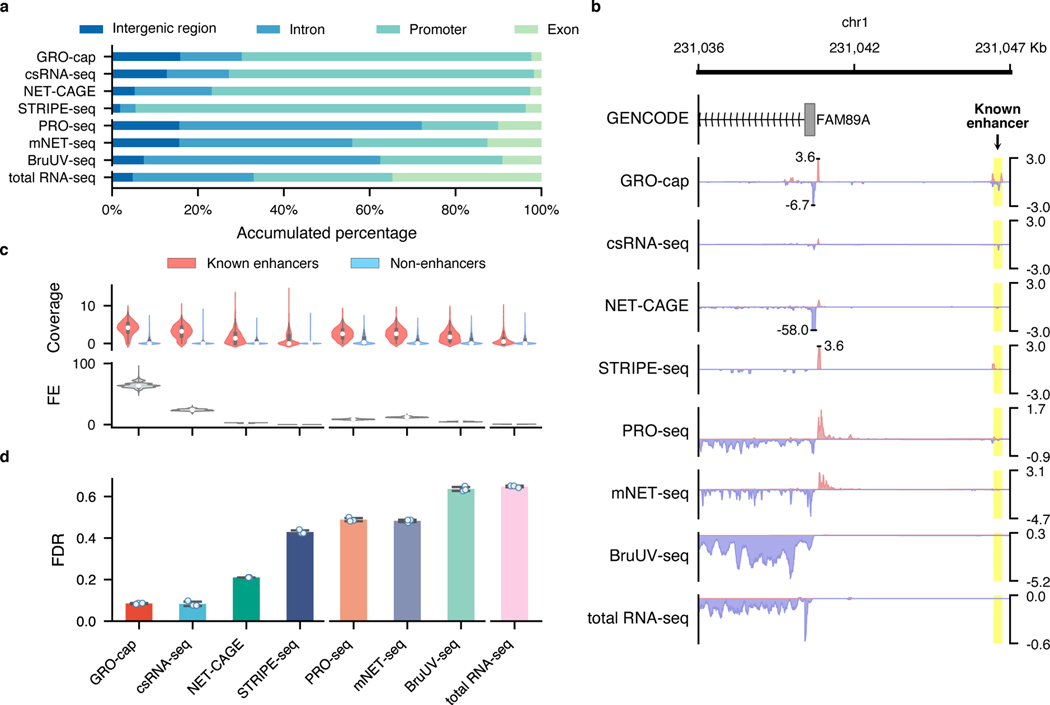
Fig. 3. Characterization of factors affecting assay sensitivity and evaluation of assay specificity in eRNA detection.
a, Genome-wide distribution of sequencing reads originated from intergenic regions, introns, exons, and promoters detected by different assays. b, A genome browser snapshot of a gene (FAM89A) and its enhancer (highlighted in yellow), demonstrating the different patterns of signals captured by TSS- (enriched in the promoter and enhancer regions) vs. NT- (enriched in the promoter and gene body regions) assays. Signals are normalized by reads per million (RPM). c, Specificity in detecting eRNAs. Top track: differences of read coverage among CRISPR-identified enhancer () and non-enhancer () loci, a pseudo-count (1) was added to each locus, and the coverage was log-transformed. Bottom track: signal-to-noise ratios depicted in forms of fold enrichment (FE), the results are based on bootstrapped samples (), median statistics are used to calculate the fold changes. In the box plot, the center dots, box limits, and whiskers denote the median, upper and lower quartiles, and 1.5× interquartile range, respectively. d, False discovery rates (FDRs) estimated by the overlap between the top 20,000 genomic bins and the reference (803 CRISPR-identified and 6,777 non-enhancer) loci. Downsampled libraries were used (); values and error bars represent the mean and SD.

