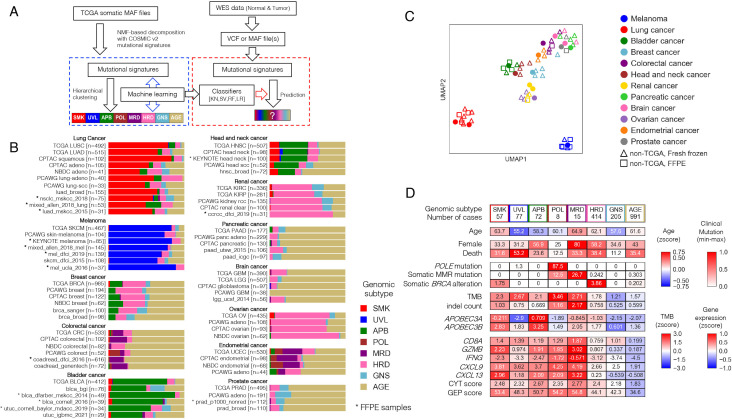
Figure 2.
Development of GS-PRACTICE. (A) Overview of the program. Using the TCGA dataset, four different classifiers were built from four different algorithms, namely k-nearest neighbor (KN), support vector machine (SV), random forest (RF), and logistic regression (LR). Using external somatic mutation profiles from WES data as input, the four classifiers output classification results. (B) Subtyping results by GS-PRACTICE for each cancer type in the publicly available data (details in online supplemental table S2). Asterisks indicate data obtained from FFPE samples, which are similar to data obtained from frozen samples. Note that for NBDC colorectal cancer, the percentage of MMRd tumors has been reported to be low in Japanese.50 (C) UMAP plot using the proportion of assigned subtypes as feature values leading to spatial projection. Marker color indicates the derived organ. Dot markers indicate TCGA data, triangles indicate non-TCGA data from frozen samples, and squares indicate non-TCGA data from FFPE samples. Datasets with the same cancer type are adjacent to each other, indicating a similar distribution of genomic subtypes across differing data sources. (D) Comparison between the genomic subtypes in PCAWG datasets with multiple cancer types (n=1916). Immune-related gene expression and scores were higher in irGS. The distribution of genomic subtypes in individual cancer types are indicated in figure 2B and online supplemental figure S11B. FFPE, formalin-fixed paraffin-embedded; CPTAC, Clinical Proteomic Tumor Analysis Consortium; GS-PRACTICE, Genomic Subtyping and Predictive Response Analysis for Cancer Tumor ICi Efficacy; irGS, immune-reactive genomic subtype; MMRd; mismatch repair deficiency; NBDC, National Bioscience Database Center; PCAWG, Pan-Cancer Analysis of Whole Genomes consortium; TCGA, The Cancer Genome Atlas.

