Figure 3.
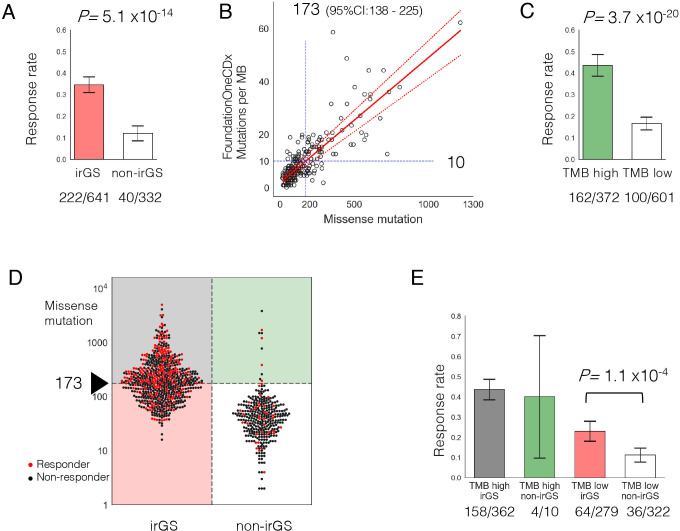
Prediction of ICI response by GS-PRACTICE and TMB. (A) ICI response rate was significantly higher in irGS tumors than non-irGS. (B) Determination of TMB cut-off. The bladder cancer dataset (n=218) from Mariathasan et al26 was examined. The number of missense mutations in the whole-exome sequencing and the number of mutations per megabase from the FoundationOneCDx panel assay were plotted. From the regression equation, 10 mutations per megabase in the panel corresponded to 173 missense mutations (95% CI 138 to 225). (C) ICI response rate was significantly higher in TMB high tumors than TMB low tumors. (D) Association between distribution of TMB and ICI response per sample divided by irGS status. Red dots indicate responders, and black dots indicate non-responders. (E) Comparison of ICI response rates in the four groups stratified by irGS and TMB status. irGS tumors had a significantly higher response rate than non-irGS within the samples classified as TMB low. GS-PRACTICE, Genomic Subtyping and Predictive Response Analysis for Cancer Tumor ICi Efficacy; ICI, immune checkpoint inhibitor; irGS, immune-reactive genomic subtype; TMB, tumor mutational burden.

