Figure 5.
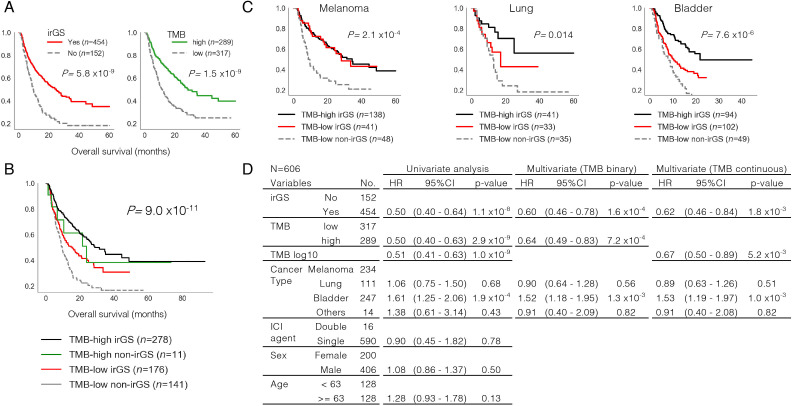
Overall survival analysis in ICI-treated cases. (A) Kaplan-Meier curve analysis. Both irGS (left) and TMB high (right) correlated with better survival outcome. (B) Stratification analysis by pairwise irGS and TMB status. The TMB-low non-irGS group showed the worst survival outcome. (C) Stratification analysis by irGS, TMB, and cancer type. The TMB-low non-irGS groups showed unfavorable outcomes when analyzed per cancer type. The TMB-high non-irGS groups are not shown due to insufficient subgroup size. (D) Cox hazard regression model analysis. Both irGS and TMB status (binary or continuous) were shown to be independent favorable prognostic factors even after adjusting for cancer type. ICI, immune checkpoint inhibitor; irGS, immune-reactive genomic subtype; TMB, tumor mutational burden.

