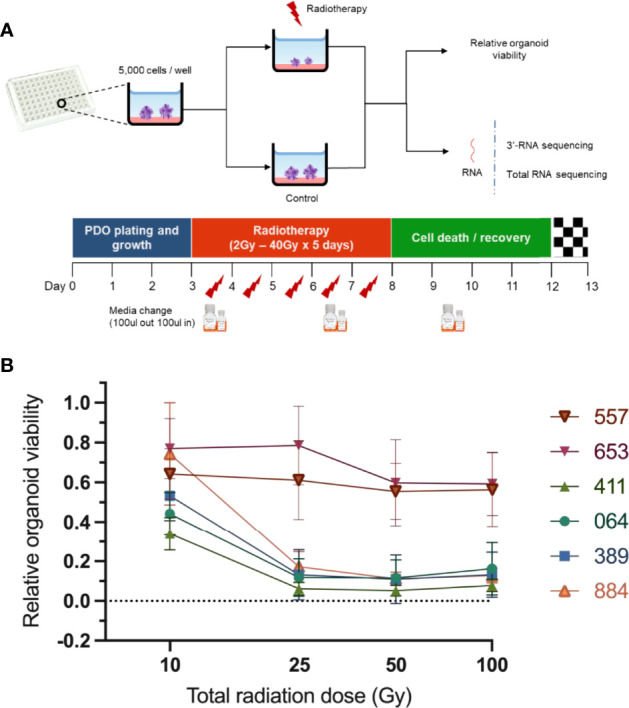
Figure 2.

Assessment of PDO lines response to radiotherapy. (A) Scheme illustrating experimental design. The PDO lines were cultured in 96-well plates (5000 organoid cells/well) and treated with different radiotherapy doses ranging from 2Gy x 5 days to 20Gy x 5 days. A chemiluminescence-based assay (CellTiter-Glo® 3D) was then used to assess relative PDO. (B) Radiation response curves of PDO lines from three independent experiments (error bars represent standard deviation).
