Figure 4.
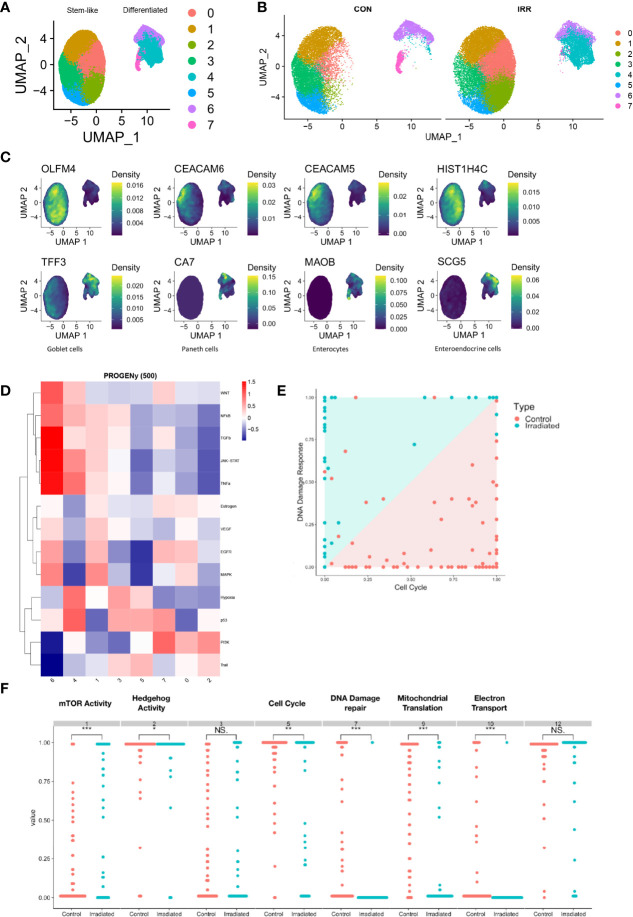
Single-cell RNA sequencing of irradiated PDOs shows cell type specific response to radiation and increase in mTOR activity in radiated cells. UMAP dimensional reduction of single-cell sequencing of irradiated (IRR) and control (CON) radiation sensitive PDOs displayed merged (A) and separately (B). (C) Markers of stem-like and differentiated clusters. (D) Heatmap illustrating pathway responsive genes (PROGENy) for each cell cluster. (E, F) Scalable Bayesian Boolean Tensor Factorisation (SBBTF) and pathway analysis showing enrichment of mTOR activity on irradiated cells. *p < 0.05, **p < 0.01, ***p < 0.001, NS, Not significant.

