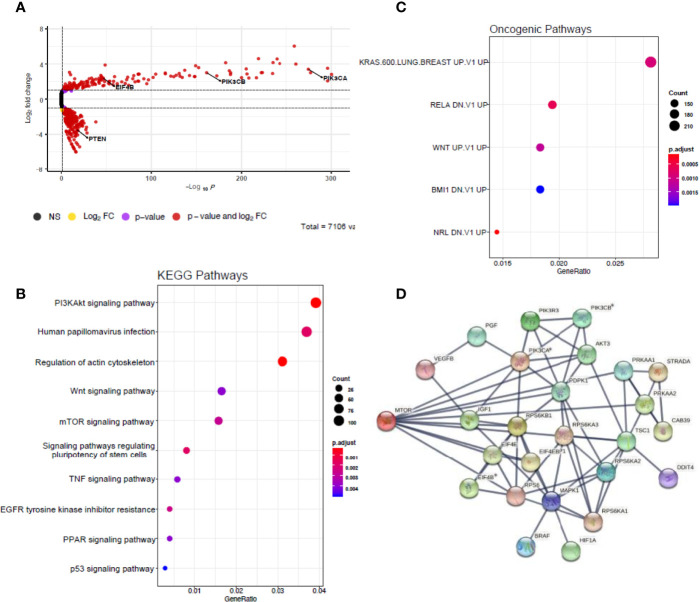
Figure 5.
Genome-wide CRISPR screens identify mTOR signalling up-regulates pathway genes. (A) Volcano plot depicting significantly differentially expressed genes (p < 0.05 and |fold change| > 1) in red. Model-based analysis of genome-wide CRISPR-Cas9 knockout on libraries A and B detected twenty-six expressed genes from mTOR signalling pathway gene list based on molecular signatures database (MSigDB) v7.4. (B) Dot plot showing significantly over-represented KEGG pathway terms that were defined from MSigDB v7.4 using the 3,207 DEGs with p < 0.05. (C) Dot plot showing significantly over-represented oncogenic pathway terms that were defined from MSigDB v7.4 using the 3,207 DEGs with p < 0.05. (D) Network diagram representing the mTOR signalling events mediated by PIK3CA, PIK3CB and EIF4B using STRING 2 weighted correlation network analysis (WGCNA). Asterisks represent statistically significant levels of gene differences between control and irradiated samples (p< 0.05) calculated using Student’s t test. NS, non-significant; FC, fold change.

