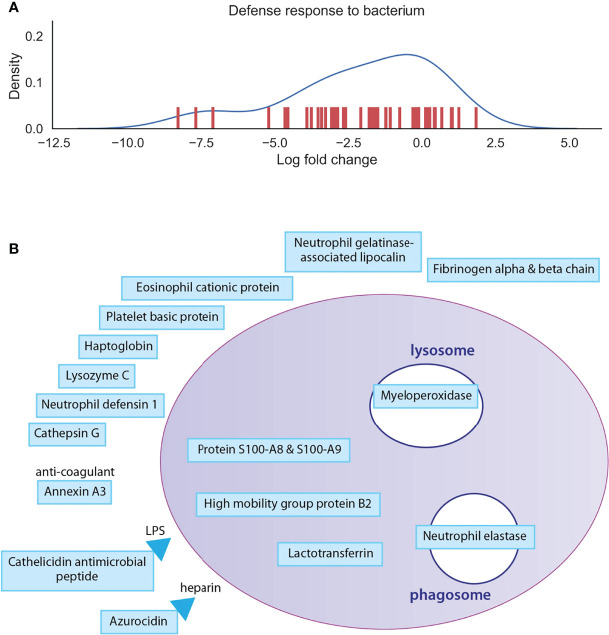
Figure 5.
Depiction of proteins significantly expressed in monocytes. (A): The density curve and individual protein differential expression log2 values of protein expressions in the defense response to bacterium pathway identified in osteoclasts. (B): drawing represents the most significantly expressed proteins involved in defense response to bacterium in monocyte samples compared to osteoclast samples. Blue filling shows downregulation of proteins in osteoclast samples compared to monocytes. The full table with p values are provided in Supplementary Table 4.

