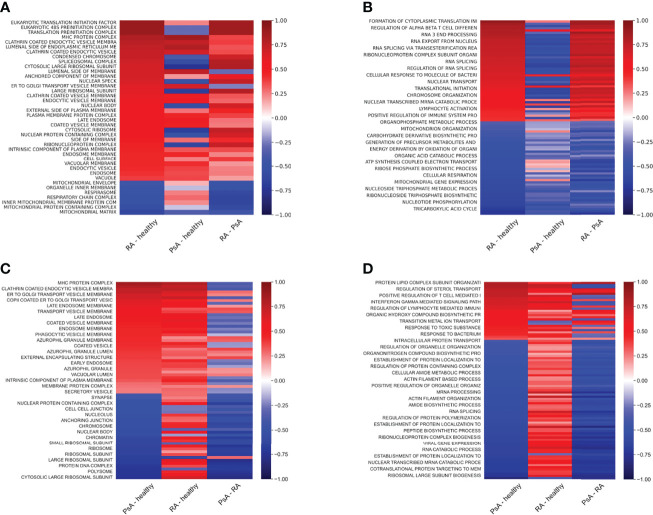
Figure 7.
Protein expression differences of RA and PsA samples compared to healthy samples. Heat maps representing the sample protein localizations (A, C), or functions (B, D) analyzed with protein GSE using GO: Cellular Compartments (A, C) and Biological Process terms (B ,D) for RA versus healthy (A, B), or PsA versus healthy (C, D) samples. Terms with the smallest adjusted p-values are shown on the heat-map. Not all terms are indicated on the y-axis, the full table with p values are provided in Supplementary Table 6.

