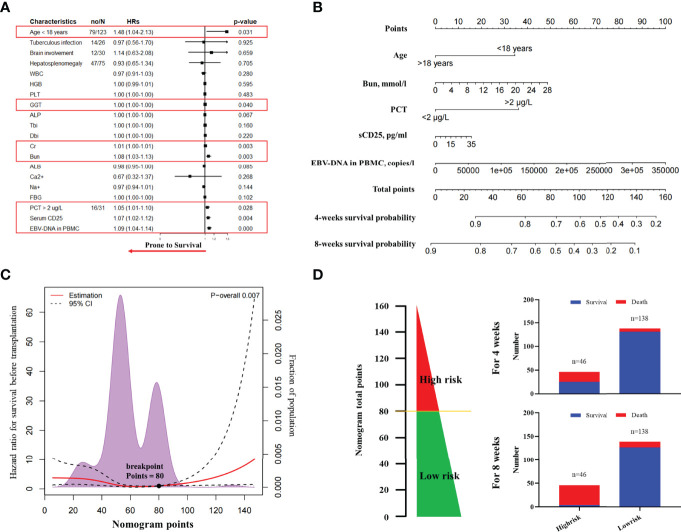
Figure 2.
The nomogram to predict the risk of death in induction therapy. (A) The forest plot of univariate Cox regression analysis. The result showed that age, GGT, Cr, Bun, PCT, sCD25, and EBV-DNA in PBMC were risk factors associated with the death in induction therapy. (B) The nomogram to predict the risk of death in induction therapy. (C) The breakpoints of nomogram points for the death in induction therapy. Using the regression discontinuity analysis, we identified the breakpoints of nomogram points as 80. (D) We categorized 46 patients as the high-risk group and 138 patients as the low-risk group. The histogram showed the death rate in each group. HR, hazard ratio; WBC, white blood cell; GGT, gamma-glutamyl transpeptidase; ALP, alkaline phosphatase; Tbi, total bilirubin; Dbi, direct bilirubin; ALB, albumin; Cr, creatinine; Bun, blood urea nitrogen; PCT, procalcitonin; EBV, Epstein–Barr virus; PBMC, peripheral blood mononuclear cell; CTL, cytotoxic T lymphocyte.

