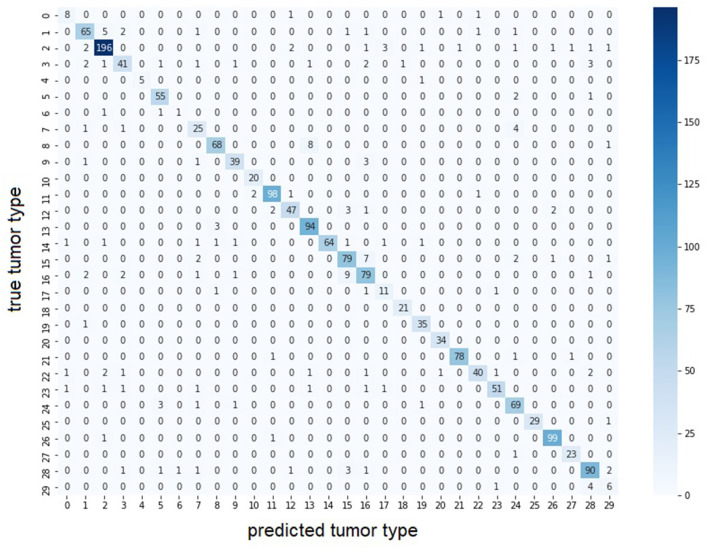
Figure 3.
Confusion matrix of multi-scale MIL model trained at 5x and 10x on the entire dataset. The largest values for each row are found on the diagonal indicating the predicted tumor type correspond to the true tumor type. Color intensity represents number of samples in the class. With lower color intensity there are less samples and the task becomes harder. Correspondence between class id and tumor name is presented in Supplementary Table 1.

