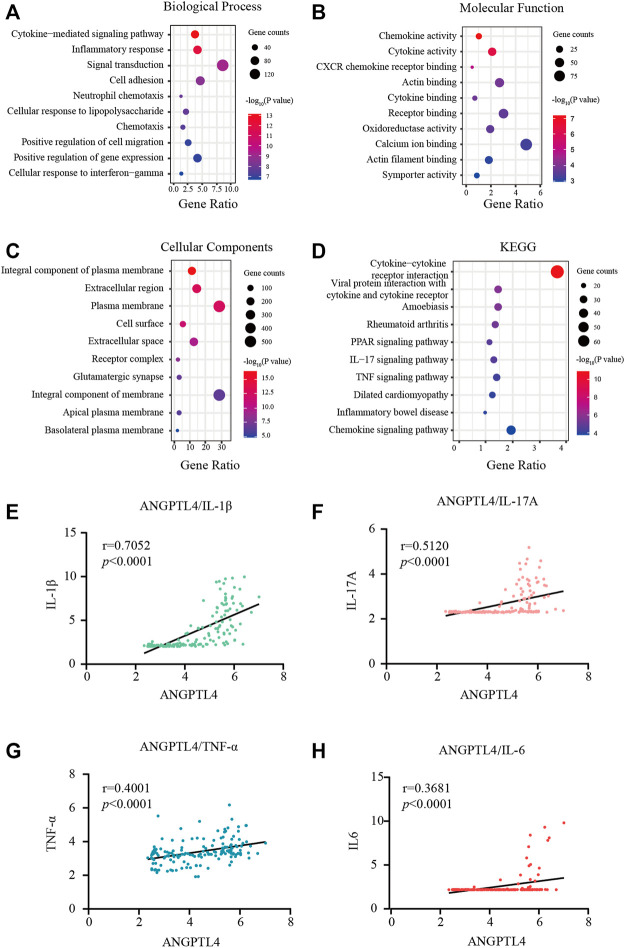
FIGURE 3.
Functional enrichment analysis. (A–C) GO terms of Biological process, Cellular component, and Molecular function for genes in the turquoise module. (D) KEGG analysis for genes in the turquoise module. (E–H) Correlation analysis between the levels of ANGPTL-4 and IL-1β, ANGPTL-4 and IL-17A, ANGPTL-4 and IL-6, ANGPTL-4 and TNF-α in the skin tissues. KEGG, Kyoto Encyclopedia of Genes and Genomes; GO, Gene Ontology.

