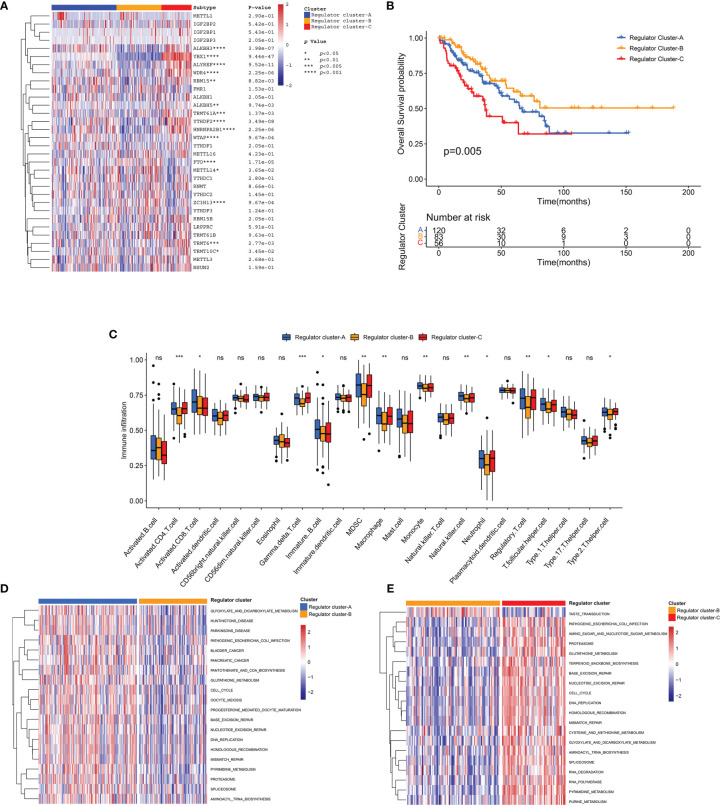
Figure 4.
Identification of regulator clusters and related biological characteristics. (A) Heatmap of 32 RNA modification regulators among distinct regulator clusters. (B) The OS curve comparing survival of the TCGA-SARC cohort in Regulator Clusters A (blue), Regulator Clusters B (orange), and Regulator Clusters C (red). (C) The infiltration of immune cells within distinct regulator clusters. The box plot extends from the 25th to 75th percentile, and the central parallel line indicates the median. (D, E) The GSVA illustrating pathway enrichment among distinct regulator clusters. ns, p ≥ 0.05; *, 0.01 ≤ p < 0.05; **, 0.001 ≤ p < 0.01; ***, 0.0001 ≤ p < 0.001.

