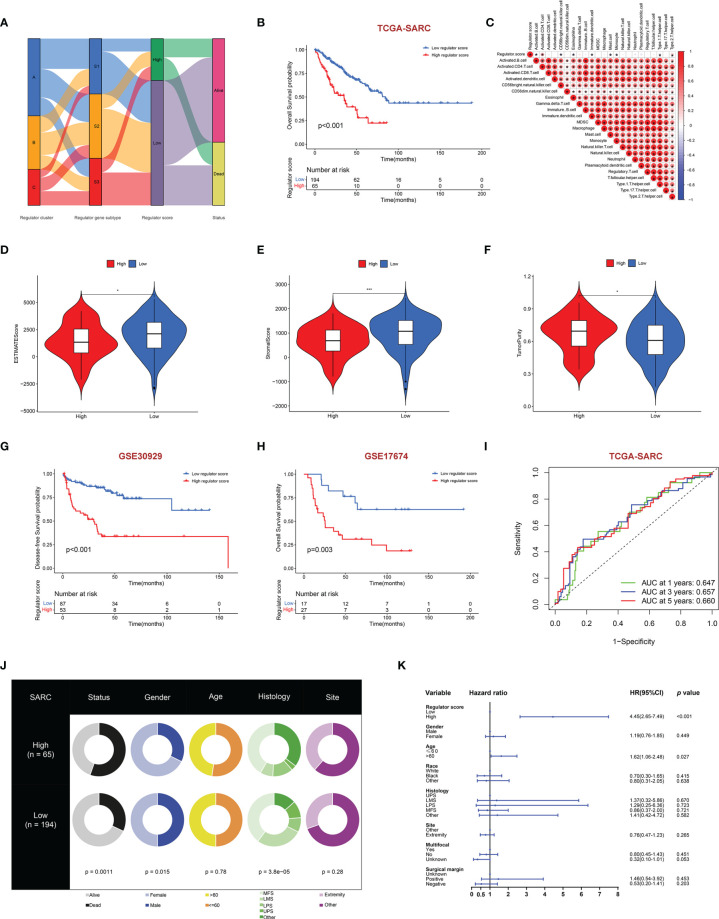
Figure 6.
Construction of regulator score and related clinical characteristics. (A) Alluvial diagram illustrating the association among regulator clusters, regulator gene subtypes, regulator score groups, and vital status. (B) The OS curve comparing survival of the TCGA-SARC cohort in low regulator score (blue) and high regulator score (red) groups. (C) Correlations between regulator score and immune cell infiltration by the Spearman correlation test. (D–F) Differences of ESTIMATES score (D), stromal score (E), and tumor purity (F) between high and low regulator score groups. (G, H) The DFS curve of GSE30928 (G) and the OS curve of GSE17674 (H) in low (blue) and high regulator score (red) groups. (I) Time-dependent ROC evaluating the predictive performance of the regulator score in the TCGA-SARC cohort. (J) Clinical characteristics between low and high regulator score groups in the TCGA-SARC cohort. (K) Multivariate Cox regression of clinical characteristics with regulator score. The horizontal line represents the 95% CI for each variable. The vertical dot line represents the HR of STS patients. *, 0.01 ≤ p < 0.05; **, 0.001 ≤ p < 0.01; ***, 0.0001 ≤ p < 0.001.

