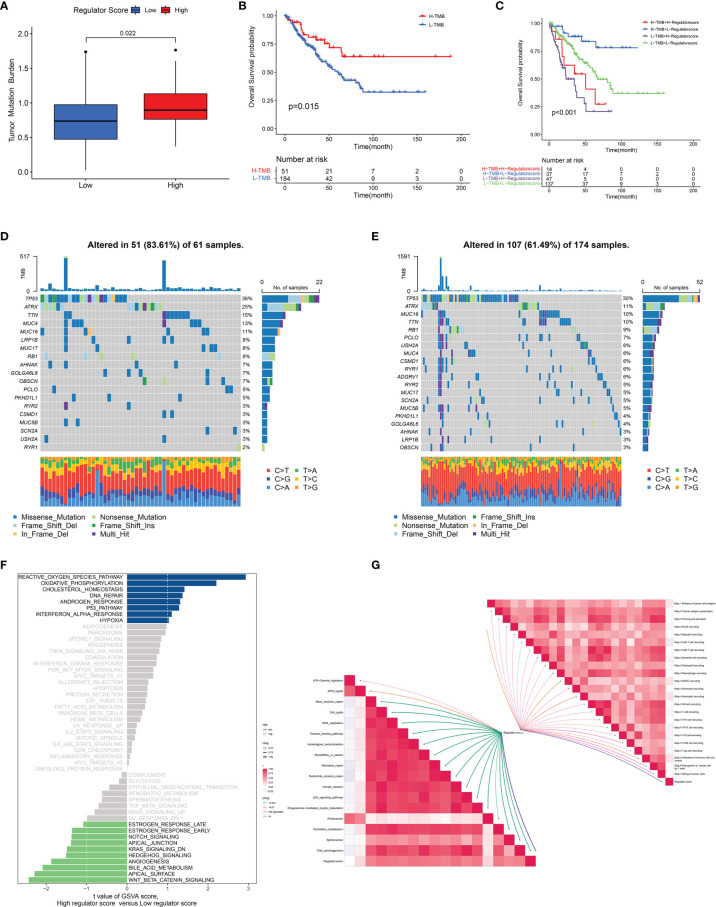
Figure 7.
Association between regulator score and biological processes. (A) The difference in the TMB level between low and high regulator score groups in the TCGA-SARC cohort. (B) The OS curve comparing survival of high- and low-TMB groups in the TCGA-SARC cohort. (C) The OS curve illustrating the subgroup analysis of TMB level and regulator score. (D, E) The somatic mutation frequency of high (D) and low (E) regulator score groups in the TCGA-SARC cohort. (F) Differences in pathway activities between low and high regulator score groups. (G) Correlation of the regulator score with immunotherapy-predicted pathways (lower left) and cancer immunity cycle (upper right).

