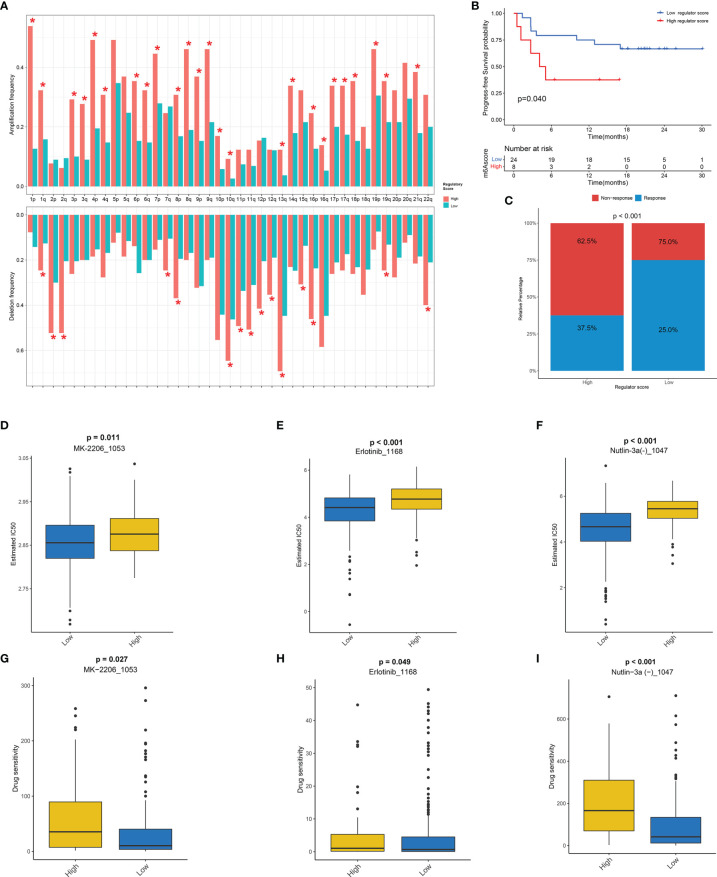
Figure 8.
The potential role of regulator score in CNV and chemotherapeutic value. (A) The frequency of arm-level amplification and deletion between low and high regulator score groups. (B) The progression-free survival (PFS) curve comparing survival of high and low regulator score groups in a cohort of melanoma patients treated with the combination of anti-PD-1 and anti-CTLA-4. (C) The proportion of clinical response to anti-PD-1 with anti-CTLA-4 immunotherapy in high and low regulator score groups in the melanoma cohort. (D–F) The box plot of the estimated IC50 of MK-2206 (D), erlotinib (E), and Nutlin-3a (F) between low and high regulator score groups. (G–I) The box plot of the predicted drug sensitivity scores of MK-2206 (G), erlotinib (H), and Nutlin-3a (I) between low and high regulator score groups. A lower drug sensitivity score indicated that this group could be more sensitive to the drug therapy. *, p < 0.05.

