Figure 1.
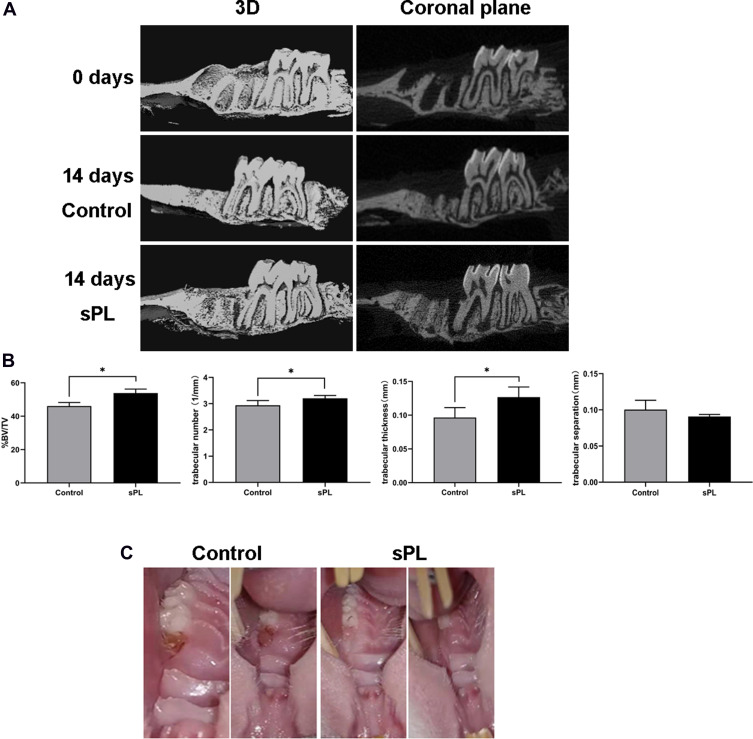
(A) Microscopic computed tomography images of the rat tooth extraction sockets. (B) Bone volume fraction (BV/TV) and trabecular number (Tb.N), trabecular thickness (Tb.Th), trabecular separation (Tb.Sp) in the extraction socket 14 days after tooth extraction. Data are expressed as mean ± standard deviation. n = 6 rats/group. *p < 0.05. (C) Images showing wound healing in the extraction socket of two randomized rats in the sPL and control group 10 days after tooth extraction.

