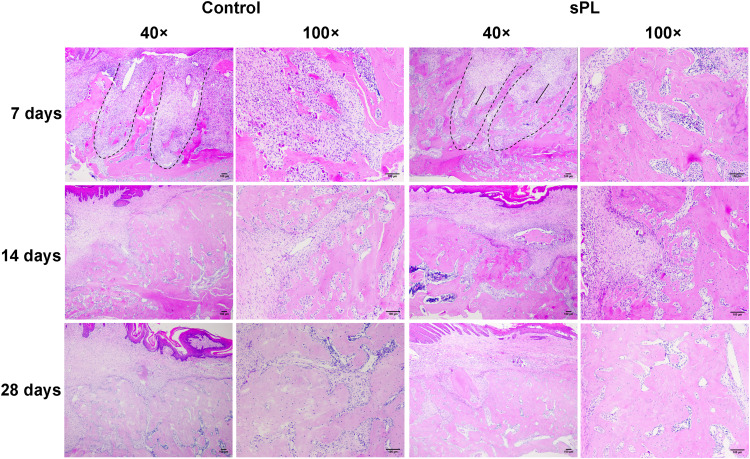
Figure 2.
Histological images of the maxillary first molar extraction sockets in the control and sPL groups 7, 14, and 28 days after tooth extraction. Hematoxylin and eosin staining; magnification: 40× and 100×. The dotted line indicates the root morphology, and the arrow indicates the newly formed bony trabeculae. Scale: 100 μm.

