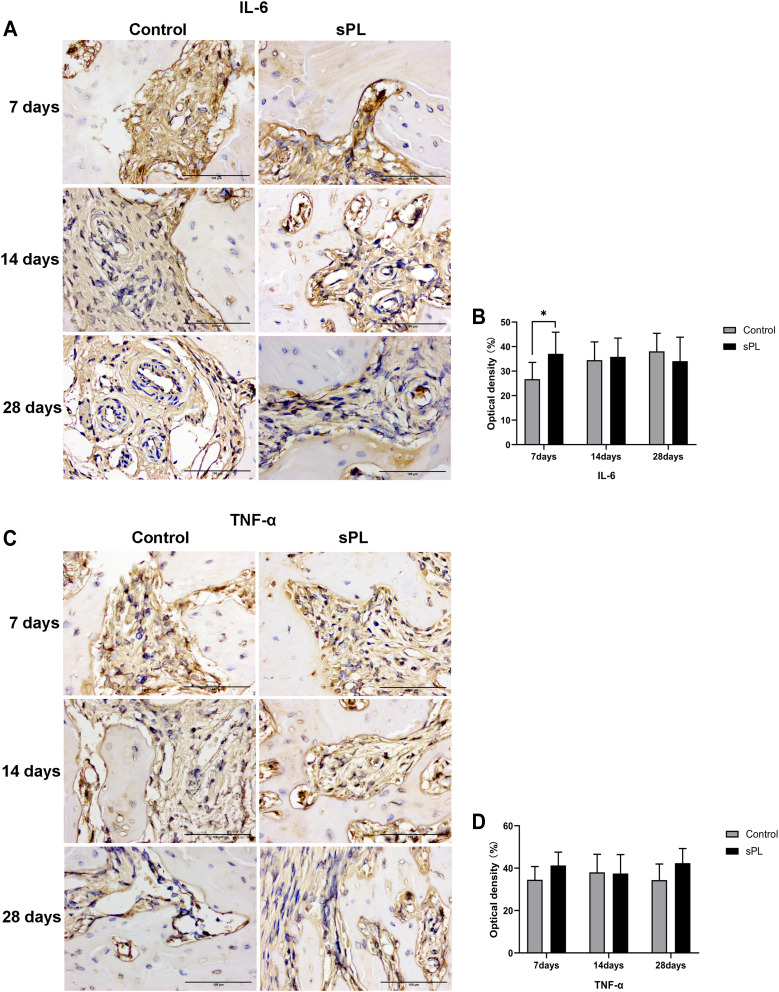
Figure 4.
Photomicrographs and graphics showing the immunoreactivity patterns of IL-6 (A and B) and TNF-α (C and D) of the rat alveolus 7, 14, and 28 days after tooth extraction. Data are expressed as mean ± standard deviation. n = 6 rats/group. *p < 0.05. Scale bar = 100 μm. Original magnification, ×400. IL-6, inter-leukin-6; TNF-α, tumor necrosis factor.

