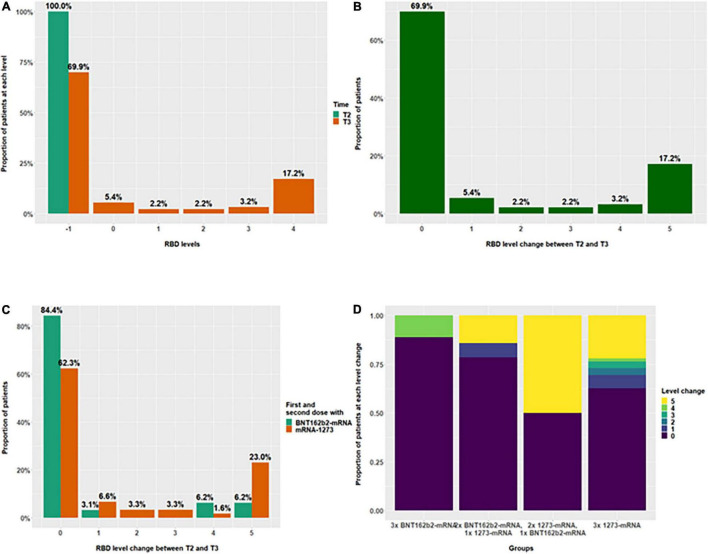
FIGURE 4.
Distribution of anti-RBD IgG level change after the 3rd vaccination in 193 kidney transplant recipients, not responding previously with seroconversion to the 1st and 2nd vaccination. The distributions of RBD levels according to interval categorizations at T2 and T3 (A), as well as their change after the third vaccination are summarized in Figures 5B–D. Level “–1” is assigned to negative test values (anti-RBD IgG < 20% inhibition [IH]). Values below the corresponding positivity threshold (35% IH) but above the threshold for negativity were assigned to level “0”. The remaining test values were divided into four intervals of approximately equal length (level “1” <50 and ≥35; level “2” <65 and ≥50; level “3” <80 and ≥65; level “4” ≥80). These intervals can be used to quantify the change of RBD levels between T2 and T3, where, for example, a positive change corresponds to an increase in RBD, with a change of five being the maximum increase, which occurred in 17.2% (B). Level changes (proportions of patients) between T2 and T3 depending on the vaccine used for 1st and 2nd vaccination are shown in panel (C), whereas, the proportions with regard to the different vaccine combinations are shown in panel (D).

