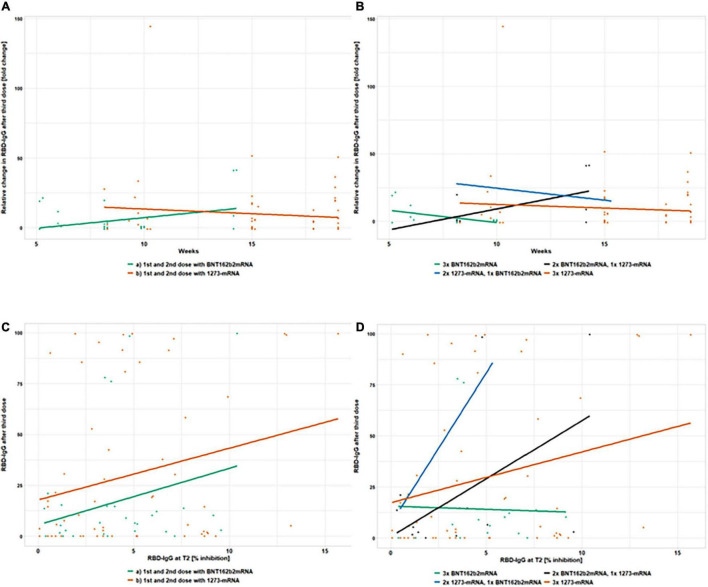
FIGURE 6.
Absolute and relative changes in anti-RBD IgG antibody titer after the 3rd vaccination in 193 kidney transplant recipients, not responding previously with seroconversion to the 1st and 2nd vaccination. This figure shows absolute and relative changes in anti-RBD IgG antibody titers between the 2nd and 3rd vaccination. At T2, 4 weeks after the second vaccination dose and T3, 3.5–5 months after the first but always 4 weeks after the third vaccination dose in 193 kidney transplant recipients, anti-RBD IgG titers are depicted in four different sub-panels. The relative change in antibody titers after a third dose vs. the number of weeks passed between the second and third dose, as well as its dependence on primary (A) and booster (B) vaccine types, are shown. In panel (A) the horizontal progression of the orange (1273-mRNA) and green (BNT162b2) lines indicate the lack of dependence on the timing of booster vaccination. The height indicates the titer levels 4 weeks after the third vaccination. The same applies to the horizontal courses of the green (3x BNTb2 mRNA), black (2x BNT162b2 mRNA, 1x 1273 mRNA), blue (2x 1273 mRNA, 1x BNT162b2 mRNA), and orange (3x 1273 mRNA) lines in panel (B) which also show a lack of dependence on the time of booster vaccination. Again, the heights represent the titer heights 4 weeks after the third vaccination. In panels (C,D) anti-RBD IgG titers after the second dose of vaccinations (despite being below positivity level) were plotted against titers after the third dose of vaccination to examine titer dependencies as predictors of an immune response. Gray lines enclose the upper and lower threshold of the test (100 and 0% inhibition, respectively). In panel (C) the incline of the orange (1273-mRNA) and green (BNT162b2) lines indicate a booster success correlation to a weak compared to no anti-RBD IgG reaction after two vaccination. The height indicates the titer levels and thus the strength of seroconversion 4 weeks after the third vaccination. The same applies to the incline of the green (3x BNTb2 mRNA), black (2x BNT162b2 mRNA, 1x 1273 mRNA), blue (2x 1273 mRNA, 1x BNT162b2 mRNA), and orange (3x 1273 mRNA) lines in panel (D) which also show a booster success correlation to a weak compared to no anti-RBD IgG reaction after two vaccination. Heights again indicate the titer levels and thus the strength of seroconversion 4 weeks after the third vaccination.

