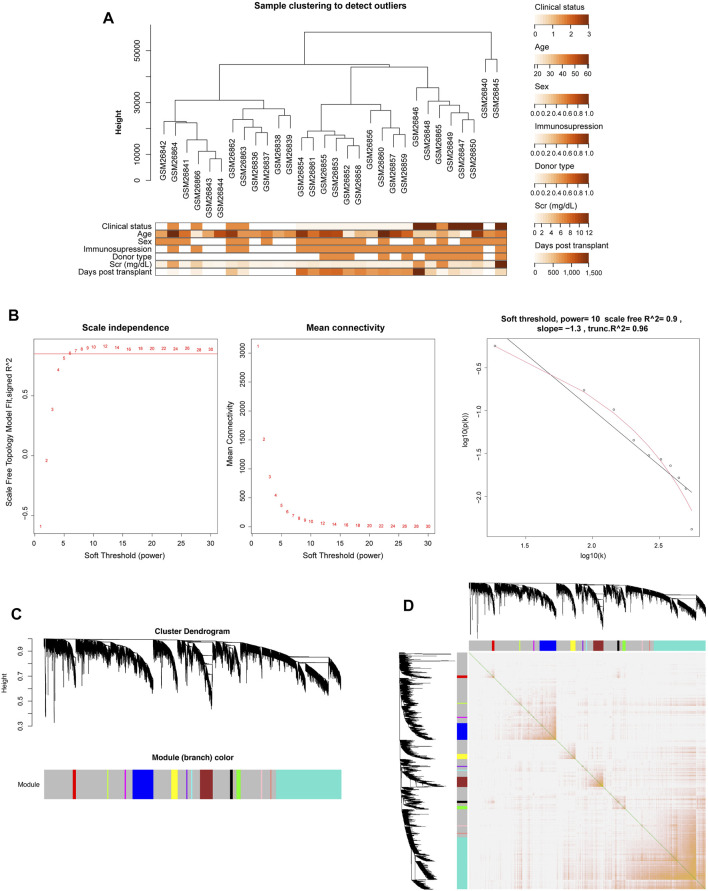
FIGURE 2.
Co-expression network construction of GSE1563 analyzed by WGCNA. (A) Hierarchical clustering dendrogram of kidney samples in GSE1563 and the corresponding clinical trait heatmap. (B) Analysis of appropriate soft-thresholding powers. The red line indicates a correlation coefficient of 0.85. The second plot shows average network connectivity under weighting coefficients. The third plot indicates the correlation of log (k) and log [P (k)]. (C) Clustering dendrograms of 9,155 genes in 30 samples, from which 14 co-expression modules were constructed with different colors. (D) Heatmap plot depicts the TOM among all genes in the analysis, which shows the interactions among co-expression modules. The stronger intensity of orange indicates greater overlaps.

