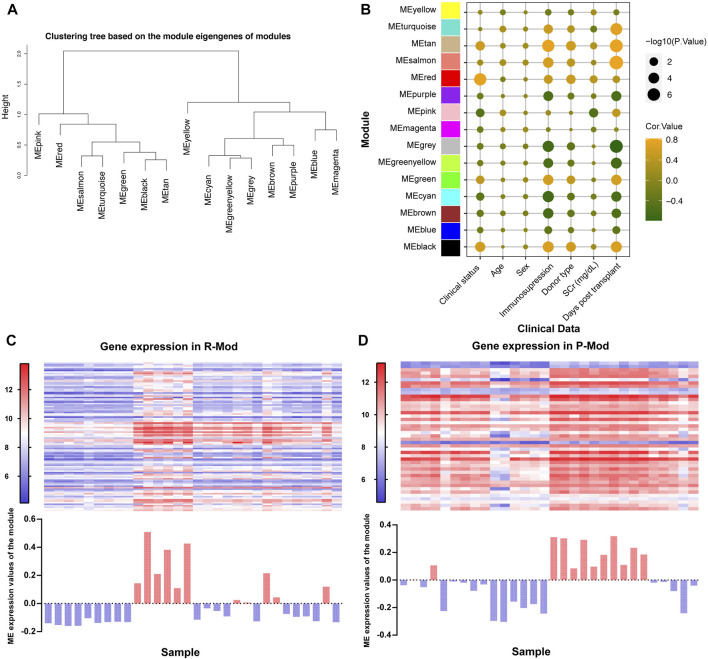
FIGURE 3.
Relationships between modules and clinical traits based on GSE1563. (A) Hierarchical clustering dendrogram of MEs. (B) Bubble plot of the association between the ME and clinical traits. The color represents the correlation coefficient, while the size shows the corresponding -log (p-value). (C,D) Upper heatmap shows the expression levels of genes P-/R-Mod in each sample. The lower histogram shows the corresponding ME expression values of P-/R-Mod in each sample.

