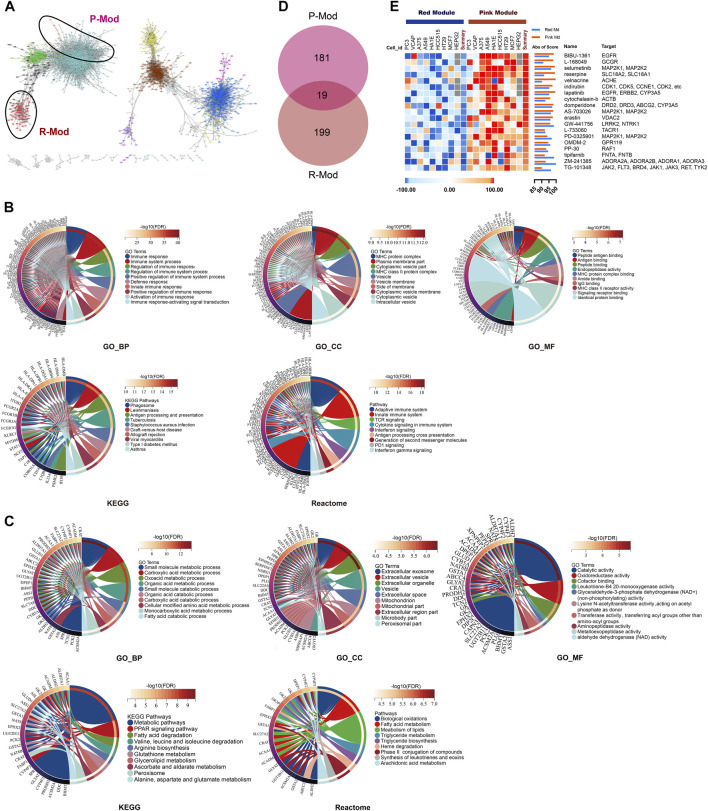
FIGURE 4.
PPI network, functional enrichment analysis, and potential targeted therapeutics based on SCr-related modules. (A) Interaction network analysis based on WGCNA. Each dot is color-coded by its corresponding module. R-/P-Mod are marked with circles. (B,C) Chord plots of the enriched GO/KEGG/Reactome terms of R- (B)/P-Mod (C). (D) Venn plot depicts the overlap of 19 small molecular compounds identified in both red-module-targeted (Score ≥90) and pink-module-targeted (Score ≥90) compounds. (E) Heatmap of expression pattern scores of 19 targeted compounds in P- and R-Mod, respectively.

