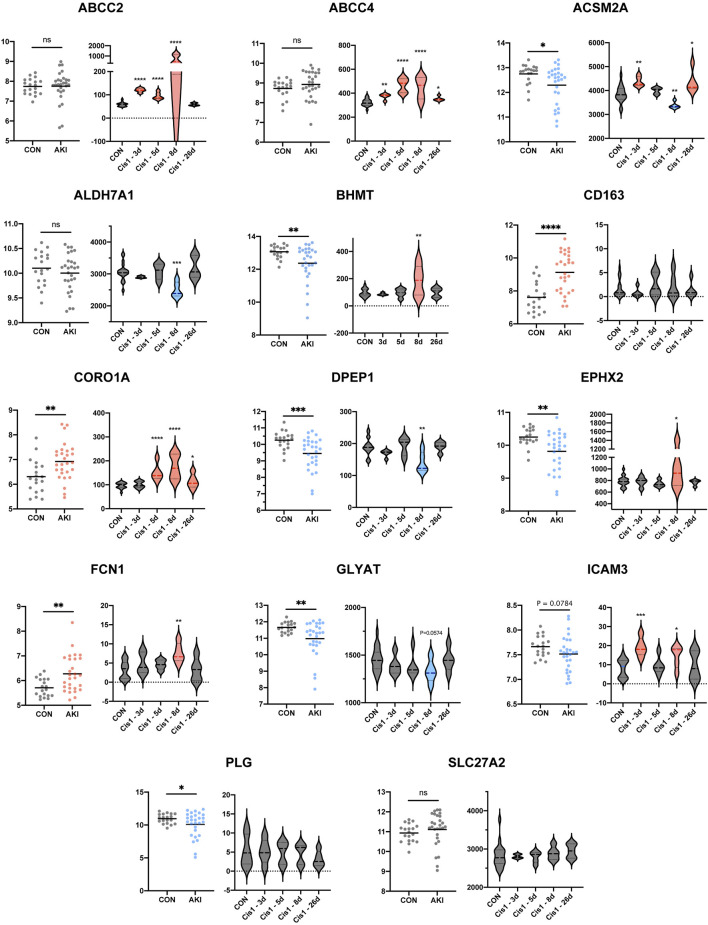
FIGURE 7.
Extensive new dataset validation of key genes based on GSE30718 and GSE85957. Histogram plot shows expression level between control and AKI groups based on human datasets GSE30718 (left). Different expressions along with time course are depicted in boxplots (right). *p < 0.05, **p < 0.01, ***p < 0.001, and ****p < 0.0001 vs. the control group.

